| Red | Green | Blue | |
| z | 17.64 | ||
| znorm | Inf | ||
| sky | -Inf | -Inf | -Inf |
| S/N | 42.2 | 62.0 | 69.4 |
| S/N(c) | 0.0 | 0.0 | 0.0 |
| SN(E/C) |
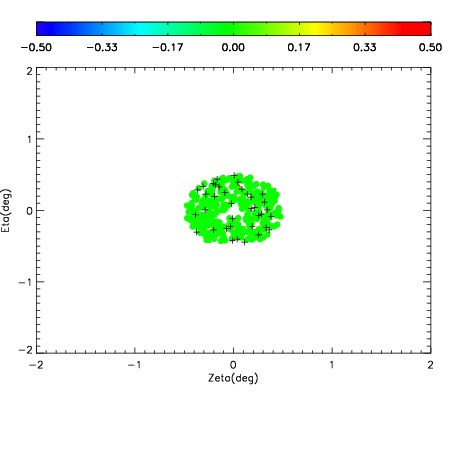
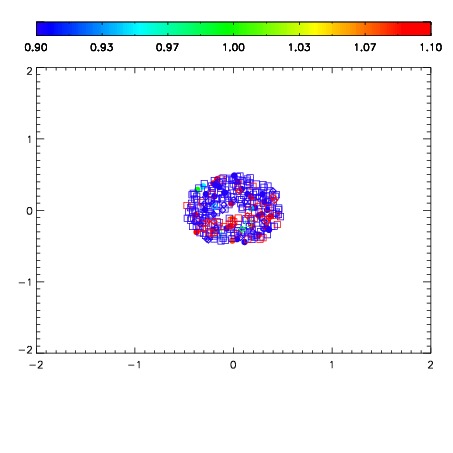
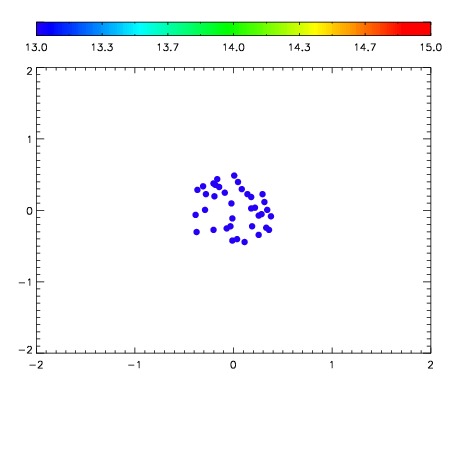

| Frame | Nreads | Zeropoints | Mag plots | Spatial mag deviation | Spatial sky 16325A emission deviations (filled: sky, open: star) | Spatial sky continuum emission | Spatial sky telluric CO2 absorption deviations (filled: H < 10) | |||||||||||||||||||||||
| 0 | 0 |
|
|
|
|
|
|
| 01900073 | 0.00000 | 154.546 |
| 01900074 | 0.00000 | 157.583 |
| 01900075 | 0.00000 | 157.187 |
| 01900076 | 0.00000 | 162.910 |
| 01900077 | 0.00000 | 162.796 |
| 01900078 | 0.00000 | 155.810 |
| 01900079 | 0.00000 | 162.411 |