| Red | Green | Blue | |
| z | 17.64 | ||
| znorm | Inf | ||
| sky | -Inf | -Inf | -Inf |
| S/N | 24.4 | 43.3 | 47.4 |
| S/N(c) | 0.0 | 0.0 | 0.0 |
| SN(E/C) |
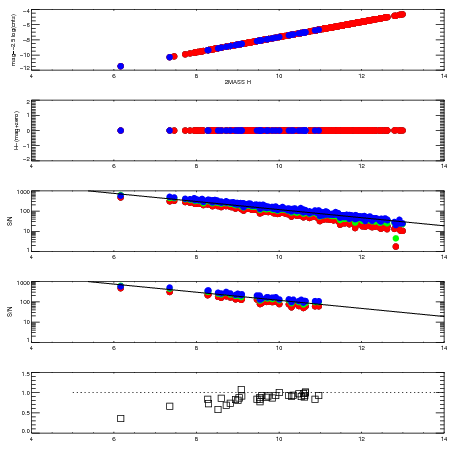
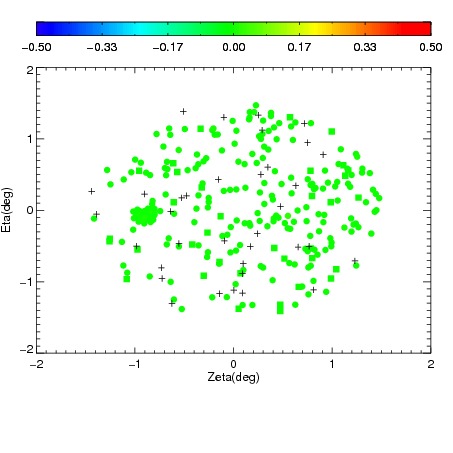
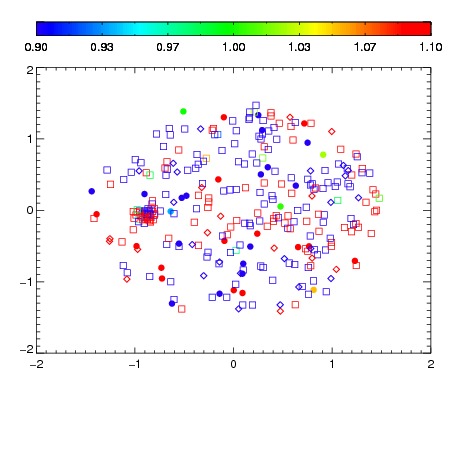
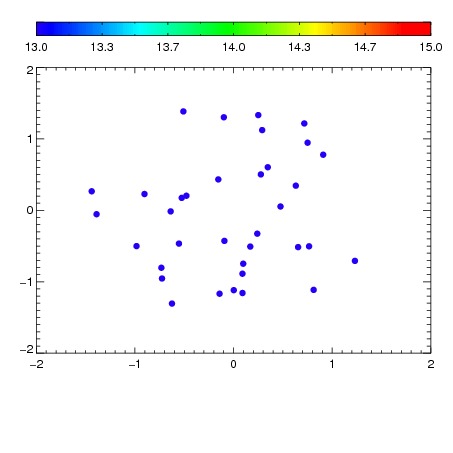

| Frame | Nreads | Zeropoints | Mag plots | Spatial mag deviation | Spatial sky 16325A emission deviations (filled: sky, open: star) | Spatial sky continuum emission | Spatial sky telluric CO2 absorption deviations (filled: H < 10) | |||||||||||||||||||||||
| 0 | 0 |
|
|
|
|
|
|
| IPAIR | NAME | SHIFT | NEWSHIFT | S/N | NAME | SHIFT | NEWSHIFT | S/N |
| 0 | 02490018 | 0.416876 | 0.00000 | 200.357 | 02490020 | 0.00237847 | 0.414498 | 207.695 |
| 1 | 02490017 | 0.415236 | 0.00163999 | 196.667 | 02490016 | 0.00000 | 0.416876 | 204.968 |
| 2 | 02490022 | 0.416472 | 0.000404000 | 188.934 | 02490019 | 0.00306999 | 0.413806 | 201.592 |
| 3 | 02490021 | 0.414971 | 0.00190499 | 186.954 | 02490023 | 0.00299917 | 0.413877 | 196.107 |