| Red | Green | Blue | |
| z | 17.64 | ||
| znorm | Inf | ||
| sky | -NaN | -Inf | -Inf |
| S/N | 26.1 | 44.9 | 49.5 |
| S/N(c) | 0.0 | 0.0 | 0.0 |
| SN(E/C) |
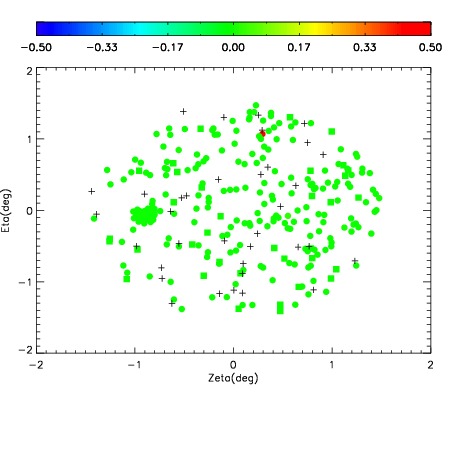
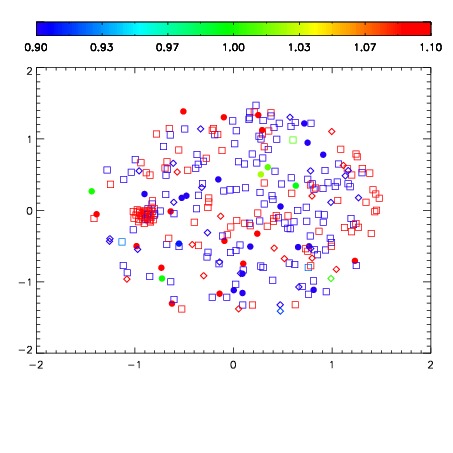
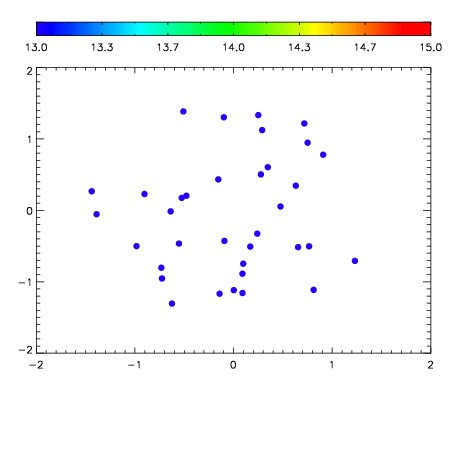

| Frame | Nreads | Zeropoints | Mag plots | Spatial mag deviation | Spatial sky 16325A emission deviations (filled: sky, open: star) | Spatial sky continuum emission | Spatial sky telluric CO2 absorption deviations (filled: H < 10) | |||||||||||||||||||||||
| 0 | 0 |
|
|
|
|
|
|
| IPAIR | NAME | SHIFT | NEWSHIFT | S/N | NAME | SHIFT | NEWSHIFT | S/N |
| 0 | 02780020 | 0.417495 | 0.00000 | 190.308 | 02780021 | 0.00809914 | 0.409396 | 192.168 |
| 1 | 02780015 | 0.413506 | 0.00398901 | 217.146 | 02780017 | 0.00786707 | 0.409628 | 214.206 |
| 2 | 02780016 | 0.416798 | 0.000697017 | 206.257 | 02780018 | 0.00171537 | 0.415780 | 212.800 |
| 3 | 02780019 | 0.415671 | 0.00182402 | 199.427 | 02780014 | 0.00000 | 0.417495 | 212.255 |