| Red | Green | Blue | |
| z | 17.64 | ||
| znorm | Inf | ||
| sky | -NaN | -Inf | -Inf |
| S/N | 31.5 | 54.6 | 58.9 |
| S/N(c) | 0.0 | 0.0 | 0.0 |
| SN(E/C) |
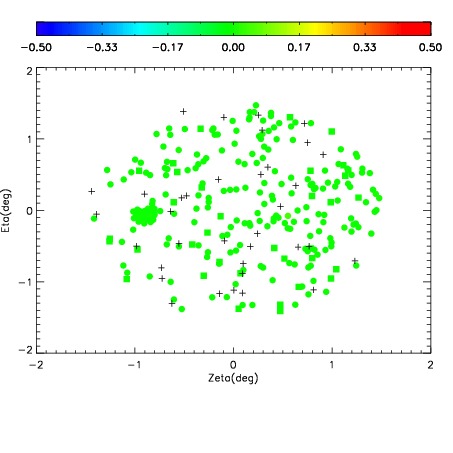
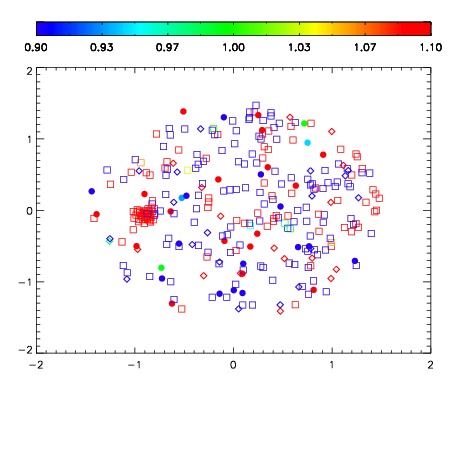
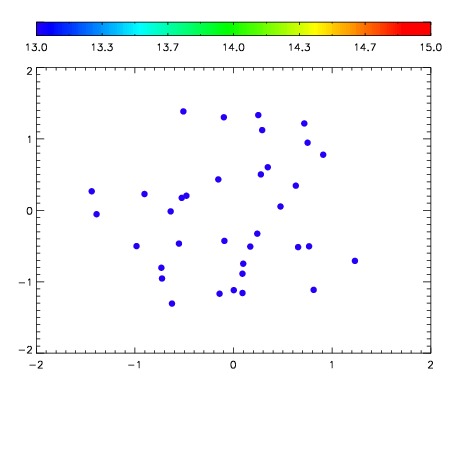

| Frame | Nreads | Zeropoints | Mag plots | Spatial mag deviation | Spatial sky 16325A emission deviations (filled: sky, open: star) | Spatial sky continuum emission | Spatial sky telluric CO2 absorption deviations (filled: H < 10) | |||||||||||||||||||||||
| 0 | 0 |
|
|
|
|
|
|
| IPAIR | NAME | SHIFT | NEWSHIFT | S/N | NAME | SHIFT | NEWSHIFT | S/N |
| 0 | 02890012 | 0.407443 | 0.00000 | 210.681 | 02890014 | 0.00152556 | 0.405917 | 208.817 |
| 1 | 02890015 | 0.399628 | 0.00781497 | 208.118 | 02890017 | 0.00290768 | 0.404535 | 207.471 |
| 2 | 02890016 | 0.400104 | 0.00733900 | 206.828 | 02890010 | 0.00000 | 0.407443 | 206.182 |
| 3 | 02890011 | 0.406239 | 0.00120398 | 205.851 | 02890013 | 0.000717547 | 0.406725 | 205.812 |
| 4 | 02890019 | 0.398331 | 0.00911200 | 202.545 | 02890018 | 0.000844944 | 0.406598 | 204.000 |