| Red | Green | Blue | |
| z | 17.64 | ||
| znorm | Inf | ||
| sky | -Inf | -Inf | -Inf |
| S/N | 20.4 | 37.1 | 40.0 |
| S/N(c) | 0.0 | 0.0 | 0.0 |
| SN(E/C) |
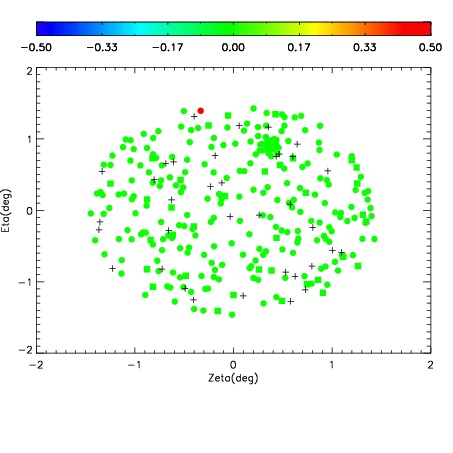
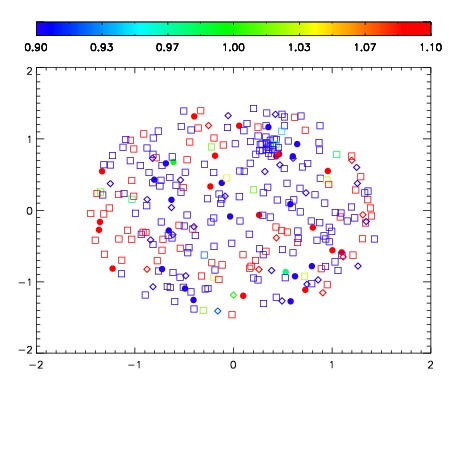


| Frame | Nreads | Zeropoints | Mag plots | Spatial mag deviation | Spatial sky 16325A emission deviations (filled: sky, open: star) | Spatial sky continuum emission | Spatial sky telluric CO2 absorption deviations (filled: H < 10) | |||||||||||||||||||||||
| 0 | 0 |
|
|
|
|
|
|
| IPAIR | NAME | SHIFT | NEWSHIFT | S/N | NAME | SHIFT | NEWSHIFT | S/N |
| 0 | 02510021 | 0.413265 | 0.00000 | 136.884 | 02510018 | 0.000728679 | 0.412536 | 203.536 |
| 1 | 02510012 | 0.403719 | 0.00954598 | 248.412 | 02510014 | 0.00104426 | 0.412221 | 236.834 |
| 2 | 02510013 | 0.406250 | 0.00701499 | 235.012 | 02510011 | 0.00000 | 0.413265 | 234.180 |
| 3 | 02510020 | 0.409259 | 0.00400600 | 173.910 | 02510015 | -0.000535709 | 0.413801 | 229.690 |
| 4 | 02510017 | 0.411055 | 0.00220999 | 96.8006 | 02510022 | 0.000902858 | 0.412362 | 55.2276 |
| 5 | 02510016 | 0.409639 | 0.00362599 | 43.2087 | 02510019 | -0.00186260 | 0.415128 | 54.5477 |