| Red | Green | Blue | |
| z | 17.64 | ||
| znorm | Inf | ||
| sky | -Inf | -Inf | -Inf |
| S/N | 27.7 | 47.8 | 51.7 |
| S/N(c) | 0.0 | 0.0 | 0.0 |
| SN(E/C) |
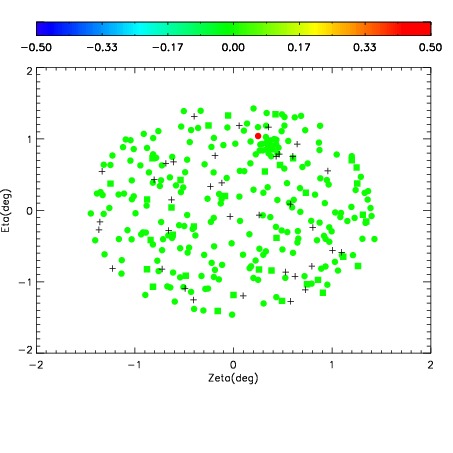
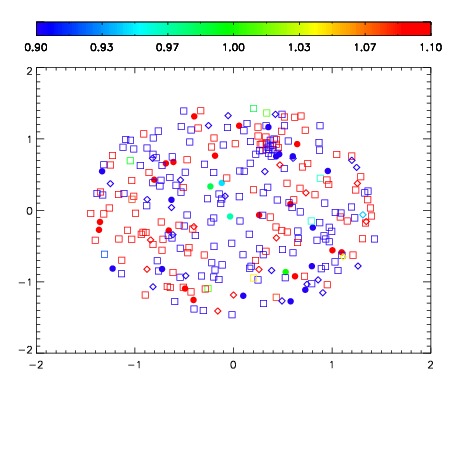
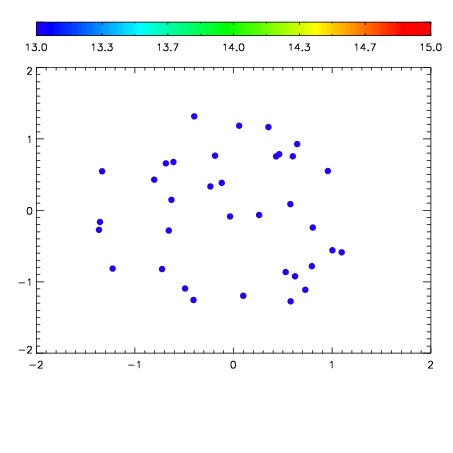

| Frame | Nreads | Zeropoints | Mag plots | Spatial mag deviation | Spatial sky 16325A emission deviations (filled: sky, open: star) | Spatial sky continuum emission | Spatial sky telluric CO2 absorption deviations (filled: H < 10) | |||||||||||||||||||||||
| 0 | 0 |
|
|
|
|
|
|
| IPAIR | NAME | SHIFT | NEWSHIFT | S/N | NAME | SHIFT | NEWSHIFT | S/N |
| 0 | 02870018 | 0.409273 | 0.00000 | 248.629 | 02870016 | 0.00150026 | 0.407773 | 250.123 |
| 1 | 02870017 | 0.408248 | 0.00102499 | 247.243 | 02870015 | 0.00278737 | 0.406486 | 247.570 |
| 2 | 02870013 | 0.406817 | 0.00245601 | 245.960 | 02870019 | 0.00519312 | 0.404080 | 247.339 |
| 3 | 02870014 | 0.408847 | 0.000425994 | 244.403 | 02870012 | 0.00000 | 0.409273 | 247.185 |