| Red | Green | Blue | |
| z | 17.64 | ||
| znorm | Inf | ||
| sky | -Inf | -NaN | -Inf |
| S/N | 29.2 | 50.3 | 53.3 |
| S/N(c) | 0.0 | 0.0 | 0.0 |
| SN(E/C) |
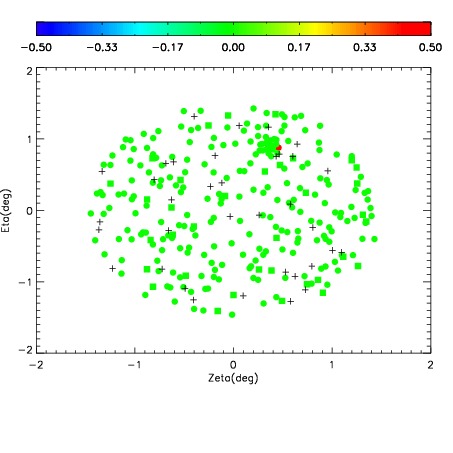
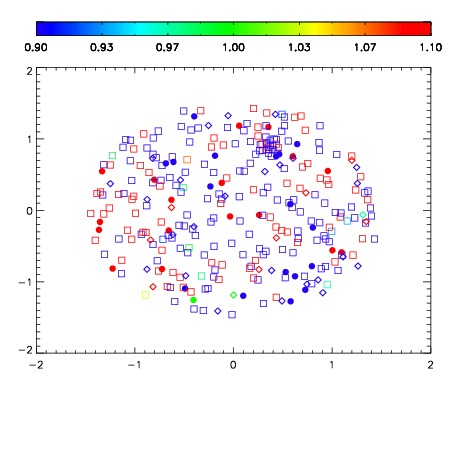
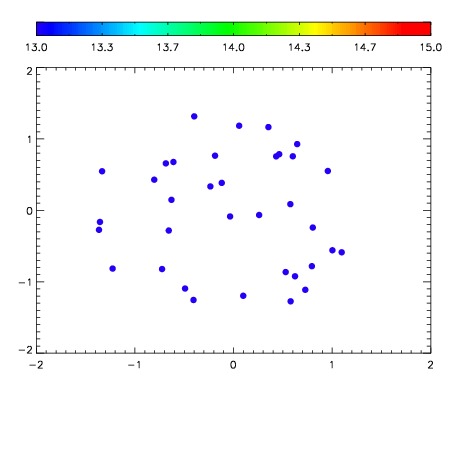

| Frame | Nreads | Zeropoints | Mag plots | Spatial mag deviation | Spatial sky 16325A emission deviations (filled: sky, open: star) | Spatial sky continuum emission | Spatial sky telluric CO2 absorption deviations (filled: H < 10) | |||||||||||||||||||||||
| 0 | 0 |
|
|
|
|
|
|
| IPAIR | NAME | SHIFT | NEWSHIFT | S/N | NAME | SHIFT | NEWSHIFT | S/N |
| 0 | 03040010 | 0.497844 | 0.00000 | 260.514 | 03040012 | -6.34359e-05 | 0.497907 | 266.096 |
| 1 | 03040013 | 0.491078 | 0.00676602 | 264.925 | 03040011 | 0.00156282 | 0.496281 | 266.241 |
| 2 | 03040009 | 0.496205 | 0.00163901 | 260.251 | 03040015 | -0.00347839 | 0.501322 | 258.279 |
| 3 | 03040014 | 0.492216 | 0.00562802 | 258.587 | 03040008 | 0.00000 | 0.497844 | 254.813 |