| Red | Green | Blue | |
| z | 17.64 | ||
| znorm | Inf | ||
| sky | -Inf | -Inf | -Inf |
| S/N | 27.6 | 46.9 | 50.2 |
| S/N(c) | 0.0 | 0.0 | 0.0 |
| SN(E/C) |
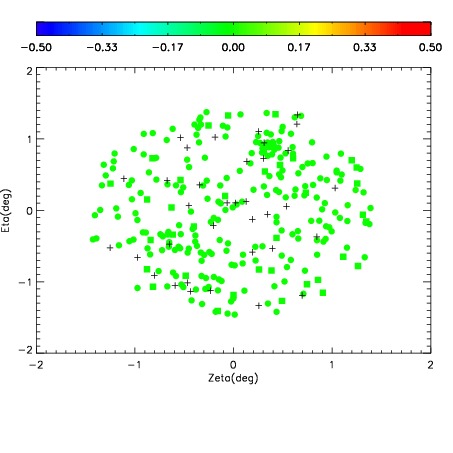
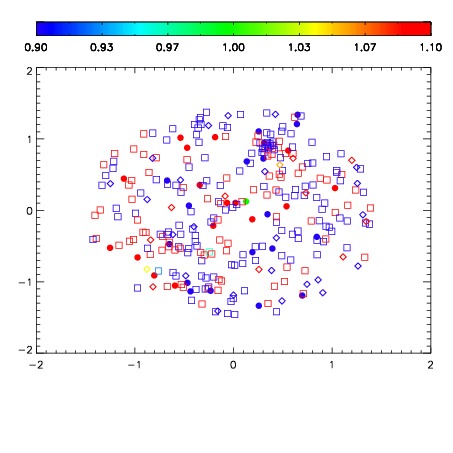
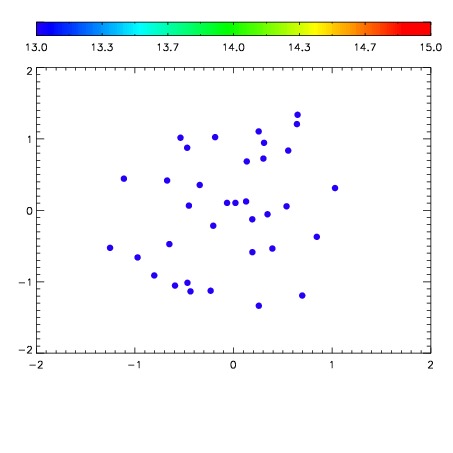

| Frame | Nreads | Zeropoints | Mag plots | Spatial mag deviation | Spatial sky 16325A emission deviations (filled: sky, open: star) | Spatial sky continuum emission | Spatial sky telluric CO2 absorption deviations (filled: H < 10) | |||||||||||||||||||||||
| 0 | 0 |
|
|
|
|
|
|
| IPAIR | NAME | SHIFT | NEWSHIFT | S/N | NAME | SHIFT | NEWSHIFT | S/N |
| 0 | 02610015 | 0.415727 | 0.00000 | 235.738 | 02610016 | 0.000719761 | 0.415007 | 243.348 |
| 1 | 02610019 | 0.414670 | 0.00105700 | 246.096 | 02610017 | -0.00236718 | 0.418094 | 251.246 |
| 2 | 02610014 | 0.413545 | 0.00218198 | 229.293 | 02610013 | 0.00000 | 0.415727 | 241.002 |
| 3 | 02610018 | 0.413981 | 0.00174600 | 228.343 | 02610020 | 0.000311539 | 0.415415 | 234.265 |