| Red | Green | Blue | |
| z | 17.64 | ||
| znorm | Inf | ||
| sky | -Inf | -Inf | -Inf |
| S/N | 19.0 | 34.3 | 38.7 |
| S/N(c) | 0.0 | 0.0 | 0.0 |
| SN(E/C) |
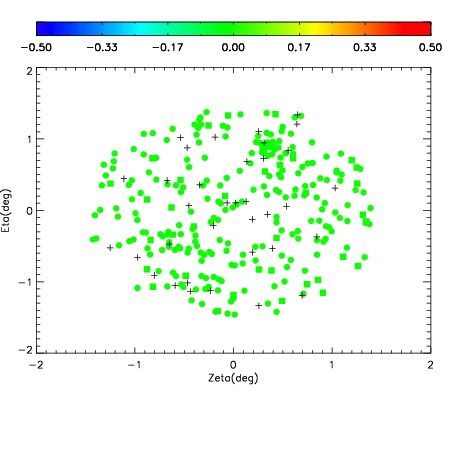
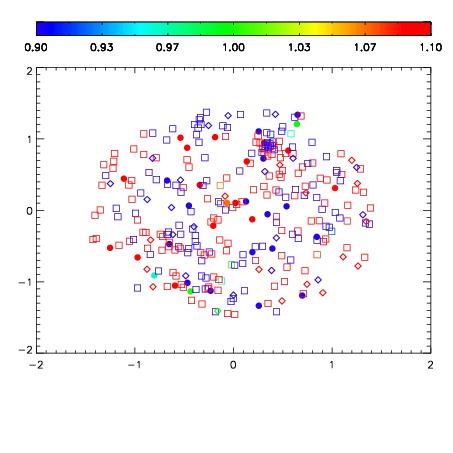
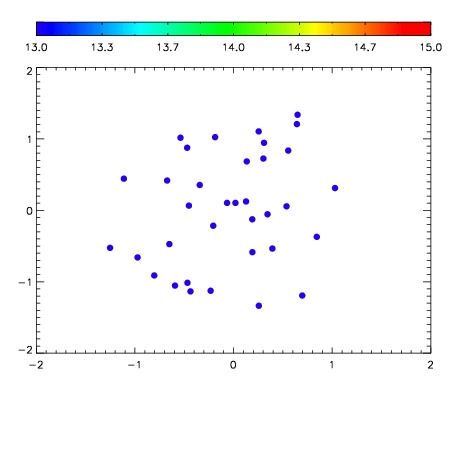

| Frame | Nreads | Zeropoints | Mag plots | Spatial mag deviation | Spatial sky 16325A emission deviations (filled: sky, open: star) | Spatial sky continuum emission | Spatial sky telluric CO2 absorption deviations (filled: H < 10) | |||||||||||||||||||||||
| 0 | 0 |
|
|
|
|
|
|
| IPAIR | NAME | SHIFT | NEWSHIFT | S/N | NAME | SHIFT | NEWSHIFT | S/N |
| 0 | 02780031 | 0.418677 | 0.00000 | 171.407 | 02780036 | 0.00579280 | 0.412884 | 160.568 |
| 1 | 02780034 | 0.416009 | 0.00266799 | 222.402 | 02780032 | 0.00608813 | 0.412589 | 195.771 |
| 2 | 02780035 | 0.417692 | 0.000984997 | 219.597 | 02780029 | 0.00000 | 0.418677 | 188.005 |
| 3 | 02780030 | 0.418030 | 0.000647008 | 175.655 | 02780033 | -0.00179567 | 0.420473 | 181.621 |