| Red | Green | Blue | |
| z | 17.64 | ||
| znorm | Inf | ||
| sky | -Inf | -Inf | -Inf |
| S/N | 28.8 | 49.5 | 54.9 |
| S/N(c) | 0.0 | 0.0 | 0.0 |
| SN(E/C) |
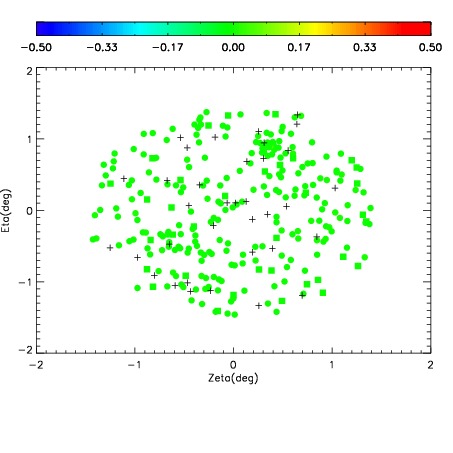
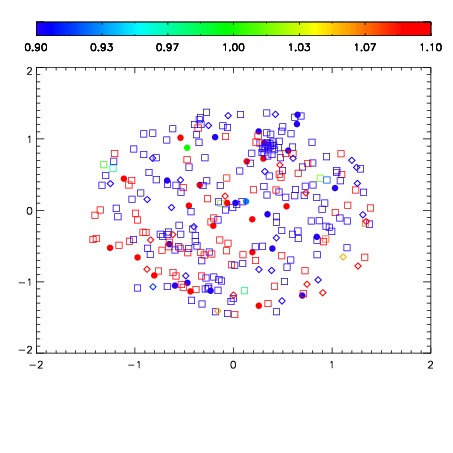
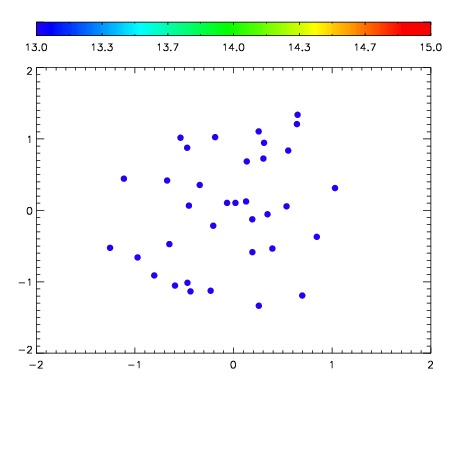

| Frame | Nreads | Zeropoints | Mag plots | Spatial mag deviation | Spatial sky 16325A emission deviations (filled: sky, open: star) | Spatial sky continuum emission | Spatial sky telluric CO2 absorption deviations (filled: H < 10) | |||||||||||||||||||||||
| 0 | 0 |
|
|
|
|
|
|
| IPAIR | NAME | SHIFT | NEWSHIFT | S/N | NAME | SHIFT | NEWSHIFT | S/N |
| 0 | 02890029 | 0.403655 | 0.00000 | 263.911 | 02890030 | 0.00159561 | 0.402059 | 258.247 |
| 1 | 02890032 | 0.400433 | 0.00322199 | 266.878 | 02890027 | 0.00000 | 0.403655 | 264.352 |
| 2 | 02890028 | 0.401456 | 0.00219899 | 263.932 | 02890031 | 0.000812019 | 0.402843 | 263.509 |
| 3 | 02890033 | 0.401863 | 0.00179198 | 256.778 | 02890034 | 0.00291548 | 0.400740 | 235.502 |