| Red | Green | Blue | |
| z | 17.64 | ||
| znorm | Inf | ||
| sky | -Inf | -Inf | -Inf |
| S/N | 22.5 | 40.7 | 43.3 |
| S/N(c) | 0.0 | 0.0 | 0.0 |
| SN(E/C) |
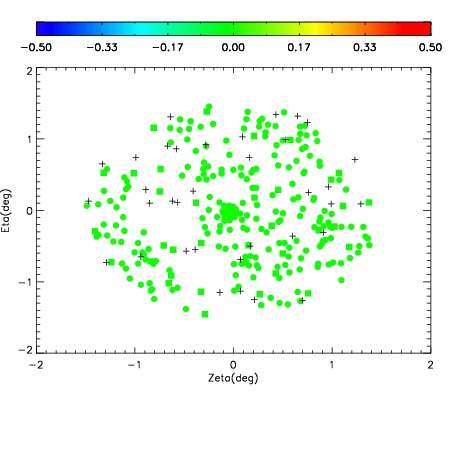
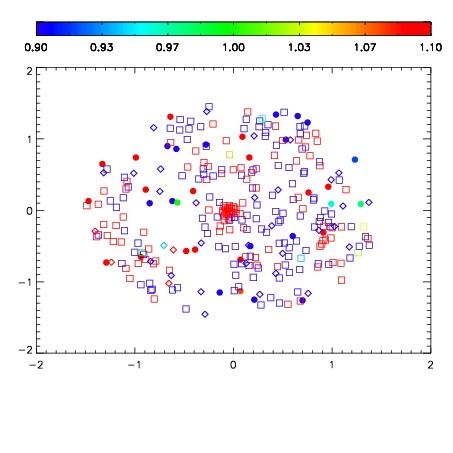
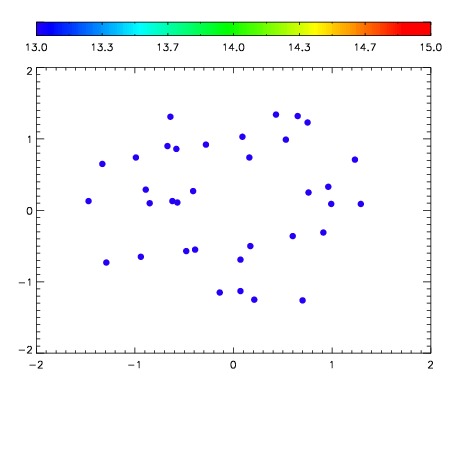

| Frame | Nreads | Zeropoints | Mag plots | Spatial mag deviation | Spatial sky 16325A emission deviations (filled: sky, open: star) | Spatial sky continuum emission | Spatial sky telluric CO2 absorption deviations (filled: H < 10) | |||||||||||||||||||||||
| 0 | 0 |
|
|
|
|
|
|
| IPAIR | NAME | SHIFT | NEWSHIFT | S/N | NAME | SHIFT | NEWSHIFT | S/N |
| 0 | 02600032 | 0.418415 | 0.00000 | 228.402 | 02600029 | 0.00394548 | 0.414470 | 222.608 |
| 1 | 02600027 | 0.416186 | 0.00222901 | 238.441 | 02600026 | 0.00000 | 0.418415 | 245.686 |
| 2 | 02600028 | 0.418405 | 1.00136e-05 | 231.708 | 02600033 | 0.00329968 | 0.415115 | 237.302 |
| 3 | 02600031 | 0.417011 | 0.00140402 | 211.839 | 02600030 | -0.000404046 | 0.418819 | 216.832 |