| Red | Green | Blue | |
| z | 17.64 | ||
| znorm | Inf | ||
| sky | -Inf | -Inf | -Inf |
| S/N | 26.5 | 45.1 | 48.4 |
| S/N(c) | 0.0 | 0.0 | 0.0 |
| SN(E/C) |
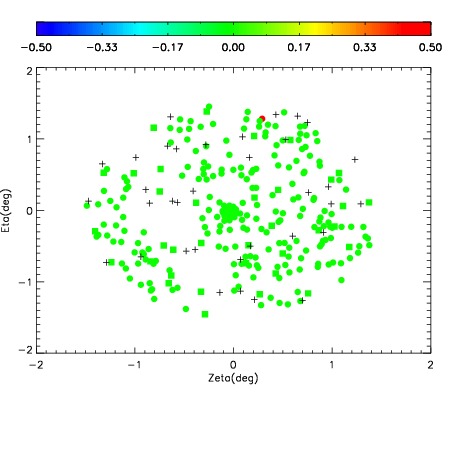
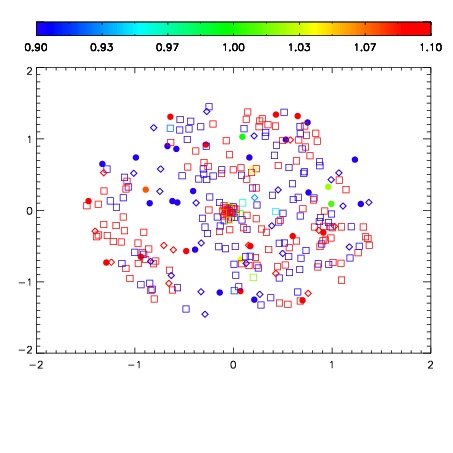
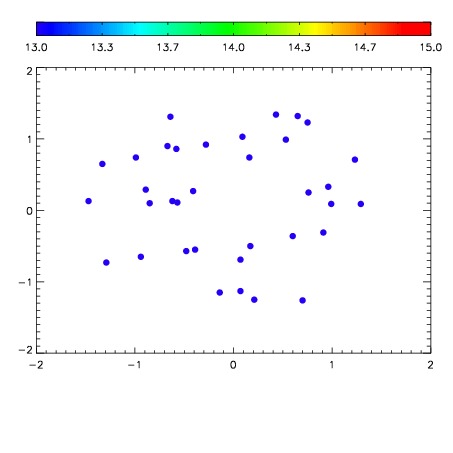

| Frame | Nreads | Zeropoints | Mag plots | Spatial mag deviation | Spatial sky 16325A emission deviations (filled: sky, open: star) | Spatial sky continuum emission | Spatial sky telluric CO2 absorption deviations (filled: H < 10) | |||||||||||||||||||||||
| 0 | 0 |
|
|
|
|
|
|
| IPAIR | NAME | SHIFT | NEWSHIFT | S/N | NAME | SHIFT | NEWSHIFT | S/N |
| 0 | 03050011 | 0.501881 | 0.00000 | 209.053 | 03050009 | 0.00000 | 0.501881 | 204.001 |
| 1 | 03050015 | 0.501860 | 2.09808e-05 | 230.142 | 03050016 | 0.000754090 | 0.501127 | 232.568 |
| 2 | 03050014 | 0.501388 | 0.000492990 | 227.930 | 03050013 | 0.000785187 | 0.501096 | 217.395 |
| 3 | 03050010 | 0.501789 | 9.20296e-05 | 209.178 | 03050012 | 0.00173473 | 0.500146 | 209.917 |