| Red | Green | Blue | |
| z | 17.64 | ||
| znorm | Inf | ||
| sky | -Inf | -Inf | -Inf |
| S/N | 27.1 | 46.8 | 49.4 |
| S/N(c) | 0.0 | 0.0 | 0.0 |
| SN(E/C) |
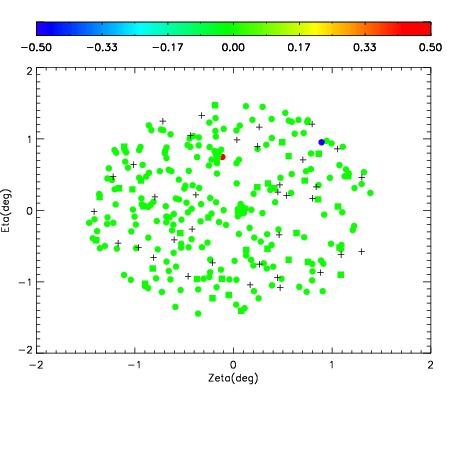
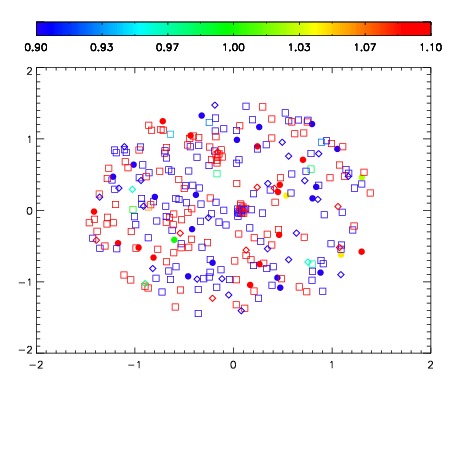
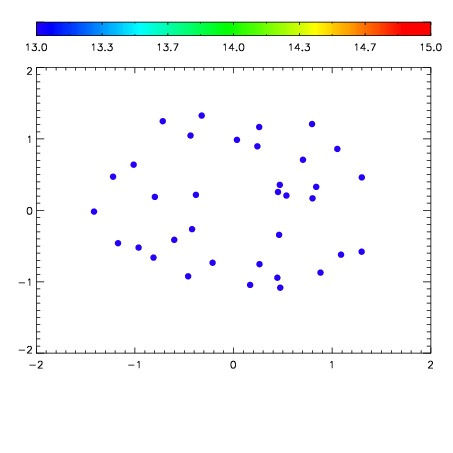

| Frame | Nreads | Zeropoints | Mag plots | Spatial mag deviation | Spatial sky 16325A emission deviations (filled: sky, open: star) | Spatial sky continuum emission | Spatial sky telluric CO2 absorption deviations (filled: H < 10) | |||||||||||||||||||||||
| 0 | 0 |
|
|
|
|
|
|
| IPAIR | NAME | SHIFT | NEWSHIFT | S/N | NAME | SHIFT | NEWSHIFT | S/N |
| 0 | 05470052 | 0.493804 | 0.00000 | 232.008 | 05470051 | 0.00329648 | 0.490508 | 230.058 |
| 1 | 05470048 | 0.493184 | 0.000620008 | 235.103 | 05470054 | 0.00311082 | 0.490693 | 238.705 |
| 2 | 05470049 | 0.492630 | 0.00117400 | 234.928 | 05470047 | 0.00000 | 0.493804 | 234.941 |
| 3 | 05470053 | 0.493263 | 0.000541002 | 234.050 | 05470050 | 0.00334936 | 0.490455 | 232.673 |