| Red | Green | Blue | |
| z | 17.64 | ||
| znorm | Inf | ||
| sky | -Inf | -Inf | -Inf |
| S/N | 31.1 | 52.0 | 57.1 |
| S/N(c) | 0.0 | 0.0 | 0.0 |
| SN(E/C) |
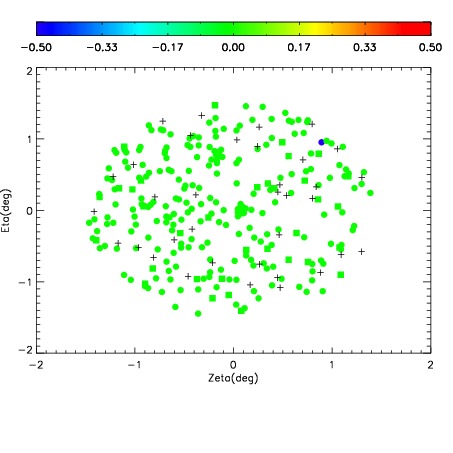
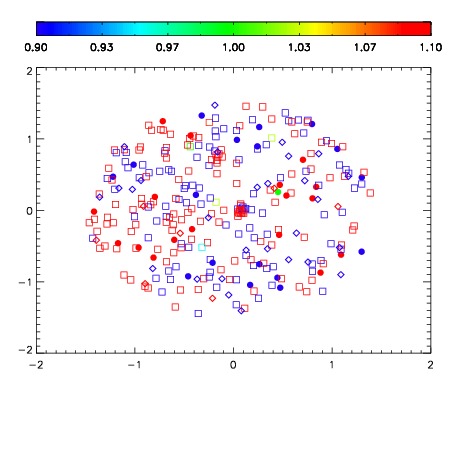


| Frame | Nreads | Zeropoints | Mag plots | Spatial mag deviation | Spatial sky 16325A emission deviations (filled: sky, open: star) | Spatial sky continuum emission | Spatial sky telluric CO2 absorption deviations (filled: H < 10) | |||||||||||||||||||||||
| 0 | 0 |
|
|
|
|
|
|
| IPAIR | NAME | SHIFT | NEWSHIFT | S/N | NAME | SHIFT | NEWSHIFT | S/N |
| 0 | 06020032 | 0.487920 | 0.00000 | 240.783 | 06020034 | -0.00123147 | 0.489151 | 250.588 |
| 1 | 06020027 | 0.485791 | 0.00212899 | 249.805 | 06020030 | -0.000328761 | 0.488249 | 255.378 |
| 2 | 06020035 | 0.486506 | 0.00141400 | 249.599 | 06020033 | 0.000434794 | 0.487485 | 253.743 |
| 3 | 06020028 | 0.486792 | 0.00112799 | 242.034 | 06020026 | 0.00000 | 0.487920 | 252.587 |
| 4 | 06020031 | 0.487480 | 0.000439972 | 240.783 | 06020029 | 0.00162287 | 0.486297 | 252.170 |