| Red | Green | Blue | |
| z | 17.64 | ||
| znorm | Inf | ||
| sky | -Inf | -NaN | -Inf |
| S/N | 25.2 | 43.1 | 46.5 |
| S/N(c) | 0.0 | 0.0 | 0.0 |
| SN(E/C) |
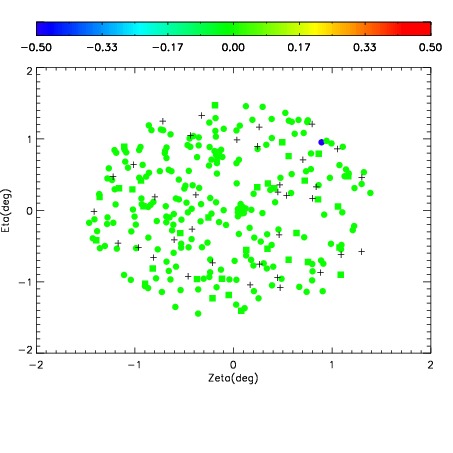
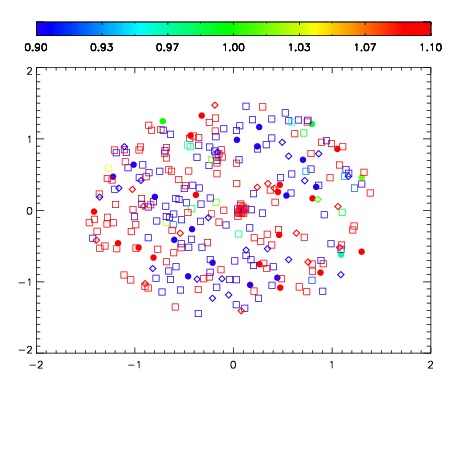
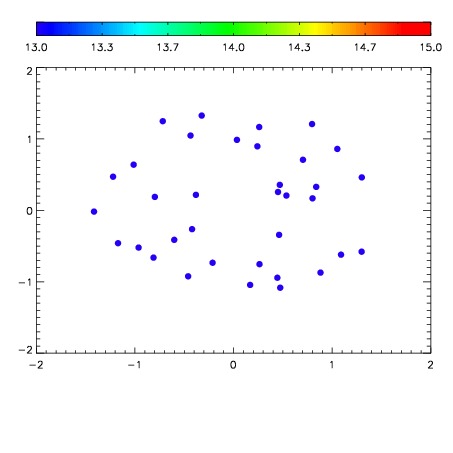

| Frame | Nreads | Zeropoints | Mag plots | Spatial mag deviation | Spatial sky 16325A emission deviations (filled: sky, open: star) | Spatial sky continuum emission | Spatial sky telluric CO2 absorption deviations (filled: H < 10) | |||||||||||||||||||||||
| 0 | 0 |
|
|
|
|
|
|
| IPAIR | NAME | SHIFT | NEWSHIFT | S/N | NAME | SHIFT | NEWSHIFT | S/N |
| 0 | 06070027 | 0.479944 | 0.00000 | 234.645 | 06070029 | 0.00200467 | 0.477939 | 232.155 |
| 1 | 06070026 | 0.479758 | 0.000185996 | 235.820 | 06070032 | 0.00323540 | 0.476709 | 246.370 |
| 2 | 06070030 | 0.478270 | 0.00167400 | 235.093 | 06070025 | 0.00000 | 0.479944 | 236.044 |
| 3 | 06070031 | 0.479710 | 0.000233978 | 233.308 | 06070028 | 0.00258060 | 0.477363 | 229.132 |