| Red | Green | Blue | |
| z | 17.64 | ||
| znorm | Inf | ||
| sky | -Inf | -NaN | -Inf |
| S/N | 22.0 | 40.3 | 42.4 |
| S/N(c) | 0.0 | 0.0 | 0.0 |
| SN(E/C) |
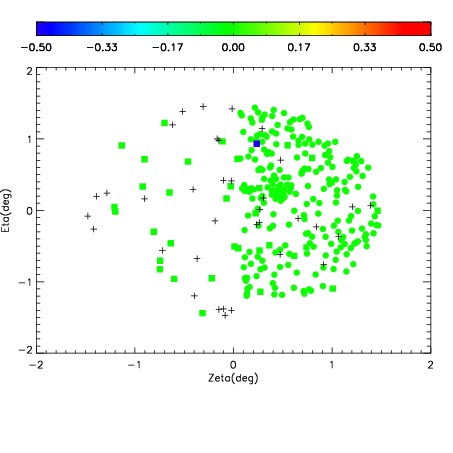
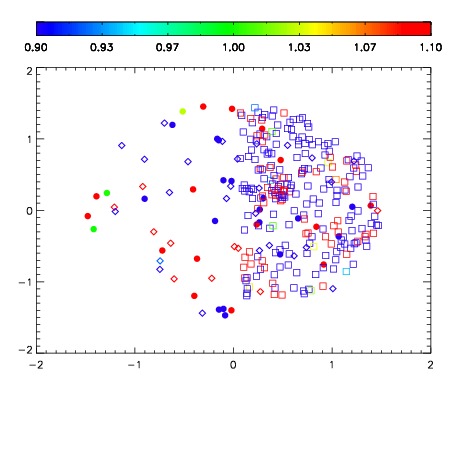
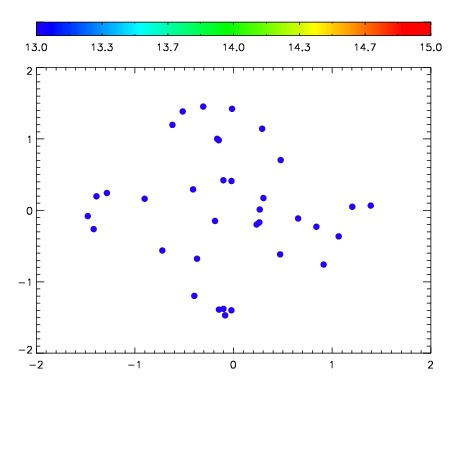

| Frame | Nreads | Zeropoints | Mag plots | Spatial mag deviation | Spatial sky 16325A emission deviations (filled: sky, open: star) | Spatial sky continuum emission | Spatial sky telluric CO2 absorption deviations (filled: H < 10) | |||||||||||||||||||||||
| 0 | 0 |
|
|
|
|
|
|
| IPAIR | NAME | SHIFT | NEWSHIFT | S/N | NAME | SHIFT | NEWSHIFT | S/N |
| 0 | 02590028 | 0.414903 | 0.00000 | 205.442 | 02590029 | 0.00281271 | 0.412090 | 206.307 |
| 1 | 02590027 | 0.412238 | 0.00266501 | 211.484 | 02590026 | 0.00000 | 0.414903 | 216.506 |
| 2 | 02590032 | 0.414441 | 0.000462025 | 192.063 | 02590030 | -0.00319622 | 0.418099 | 197.658 |
| 3 | 02590031 | 0.413239 | 0.00166401 | 183.202 | 02590033 | 0.000826862 | 0.414076 | 171.514 |