| Red | Green | Blue | |
| z | 17.64 | ||
| znorm | Inf | ||
| sky | -Inf | -Inf | -Inf |
| S/N | 16.8 | 33.2 | 36.1 |
| S/N(c) | 0.0 | 0.0 | 0.0 |
| SN(E/C) |

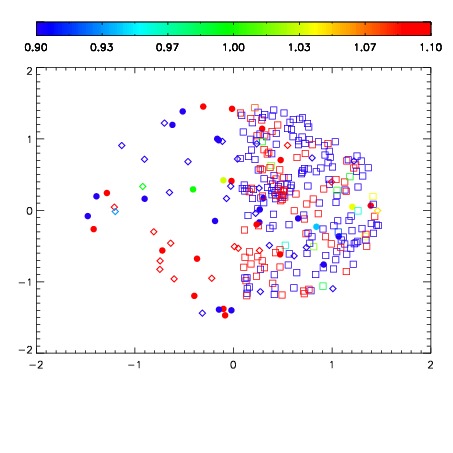
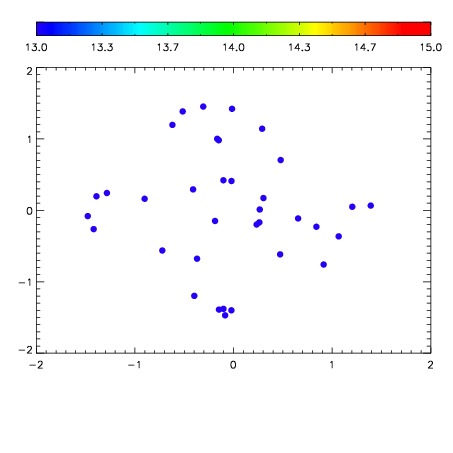

| Frame | Nreads | Zeropoints | Mag plots | Spatial mag deviation | Spatial sky 16325A emission deviations (filled: sky, open: star) | Spatial sky continuum emission | Spatial sky telluric CO2 absorption deviations (filled: H < 10) | |||||||||||||||||||||||
| 0 | 0 |
|
|
|
|
|
|
| IPAIR | NAME | SHIFT | NEWSHIFT | S/N | NAME | SHIFT | NEWSHIFT | S/N |
| 0 | 02620027 | 0.424071 | 0.00000 | 181.456 | 02620029 | -0.00128197 | 0.425353 | 172.125 |
| 1 | 02620026 | 0.419413 | 0.00465801 | 194.335 | 02620025 | 0.00000 | 0.424071 | 193.177 |
| 2 | 02620031 | 0.418137 | 0.00593400 | 159.038 | 02620028 | 0.000824914 | 0.423246 | 165.901 |
| 3 | 02620030 | 0.416419 | 0.00765201 | 158.331 | 02620032 | -0.000459802 | 0.424531 | 161.808 |