| Red | Green | Blue | |
| z | 17.64 | ||
| znorm | Inf | ||
| sky | -Inf | -Inf | -Inf |
| S/N | 18.0 | 34.0 | 34.6 |
| S/N(c) | 0.0 | 0.0 | 0.0 |
| SN(E/C) |
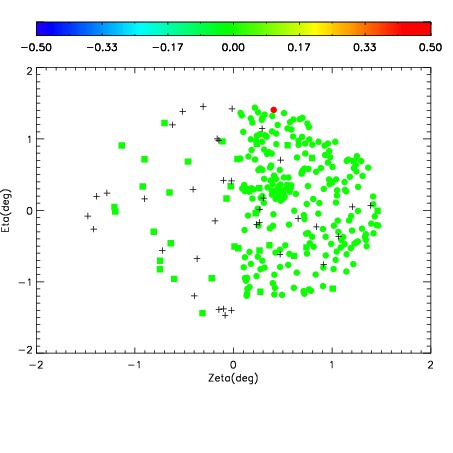
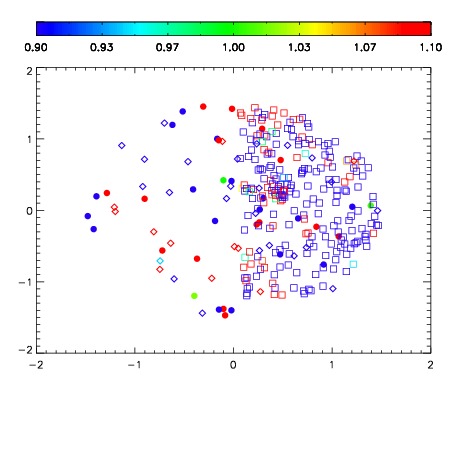
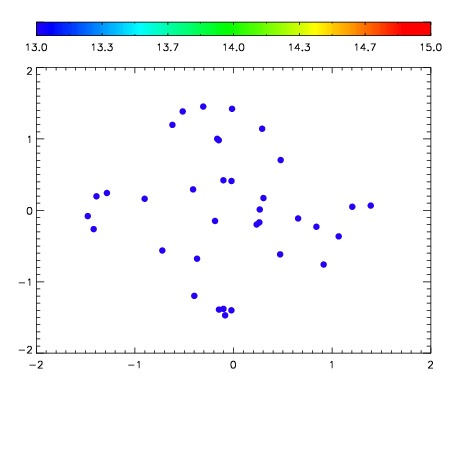

| Frame | Nreads | Zeropoints | Mag plots | Spatial mag deviation | Spatial sky 16325A emission deviations (filled: sky, open: star) | Spatial sky continuum emission | Spatial sky telluric CO2 absorption deviations (filled: H < 10) | |||||||||||||||||||||||
| 0 | 0 |
|
|
|
|
|
|
| IPAIR | NAME | SHIFT | NEWSHIFT | S/N | NAME | SHIFT | NEWSHIFT | S/N |
| 0 | 02810014 | 0.415044 | 0.00000 | 153.361 | 02810015 | -0.000228778 | 0.415273 | 151.040 |
| 1 | 02810010 | 0.413218 | 0.00182602 | 186.984 | 02810008 | 0.00000 | 0.415044 | 198.880 |
| 2 | 02810009 | 0.411222 | 0.00382200 | 186.597 | 02810011 | 0.000598972 | 0.414445 | 166.635 |
| 3 | 02810013 | 0.411935 | 0.00310901 | 156.145 | 02810012 | -0.000862898 | 0.415907 | 154.884 |