| Red | Green | Blue | |
| z | 17.64 | ||
| znorm | Inf | ||
| sky | -Inf | -Inf | -Inf |
| S/N | 24.6 | 43.8 | 48.5 |
| S/N(c) | 0.0 | 0.0 | 0.0 |
| SN(E/C) |
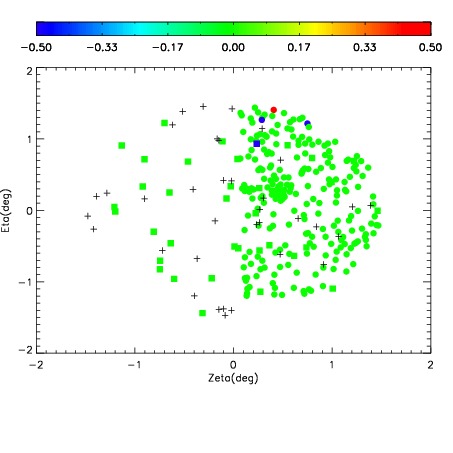
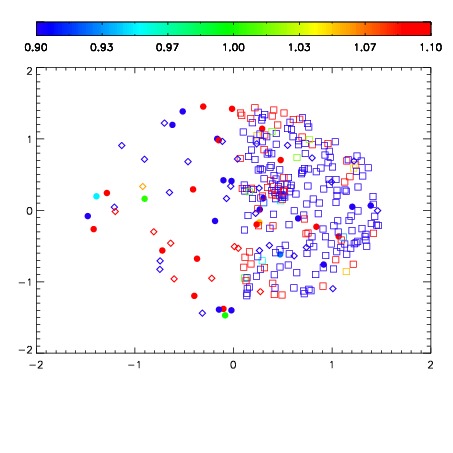
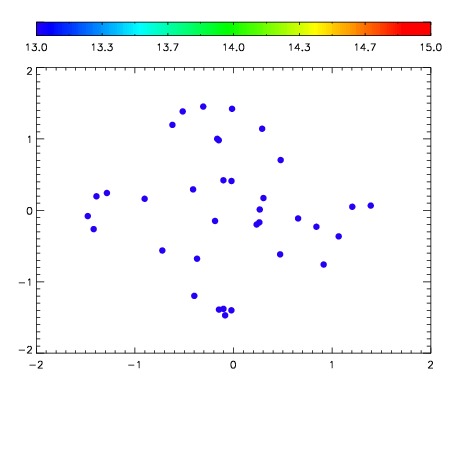

| Frame | Nreads | Zeropoints | Mag plots | Spatial mag deviation | Spatial sky 16325A emission deviations (filled: sky, open: star) | Spatial sky continuum emission | Spatial sky telluric CO2 absorption deviations (filled: H < 10) | |||||||||||||||||||||||
| 0 | 0 |
|
|
|
|
|
|
| IPAIR | NAME | SHIFT | NEWSHIFT | S/N | NAME | SHIFT | NEWSHIFT | S/N |
| 0 | 02820041 | 0.412262 | 0.00000 | 203.732 | 02820035 | 0.00000 | 0.412262 | 185.231 |
| 1 | 02820037 | 0.410351 | 0.00191098 | 212.402 | 02820038 | -0.000155279 | 0.412417 | 219.101 |
| 2 | 02820040 | 0.410063 | 0.00219899 | 208.897 | 02820039 | -0.00198465 | 0.414247 | 211.857 |
| 3 | 02820036 | 0.409904 | 0.00235799 | 204.240 | 02820042 | -0.000262835 | 0.412525 | 197.101 |