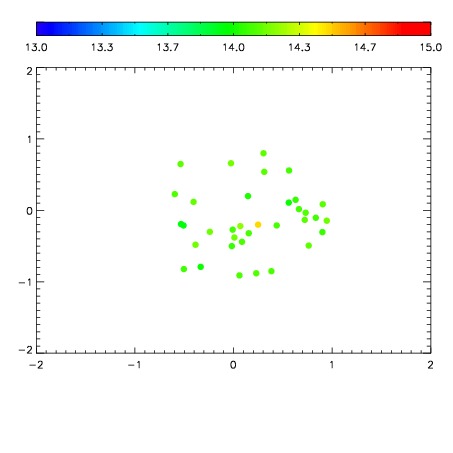
| Frame | Nreads | Zeropoints | Mag plots
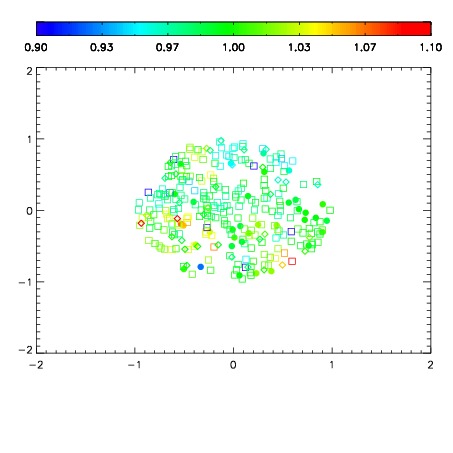
| Spatial mag deviation
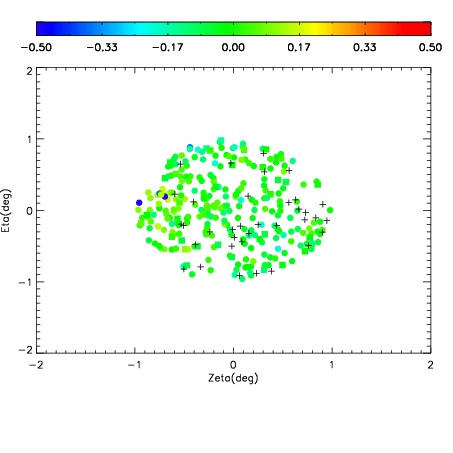
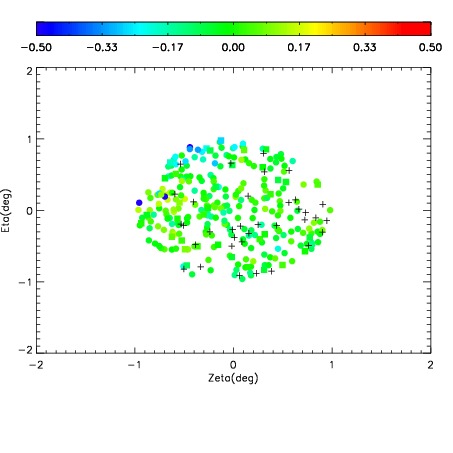
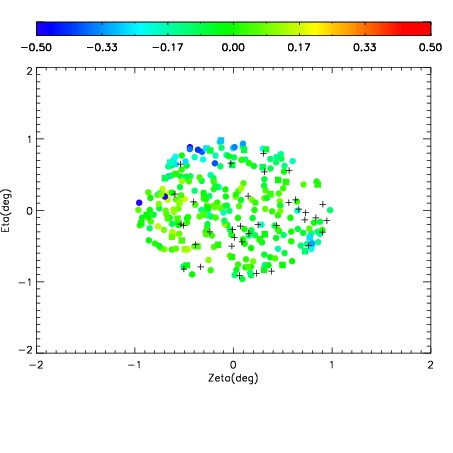
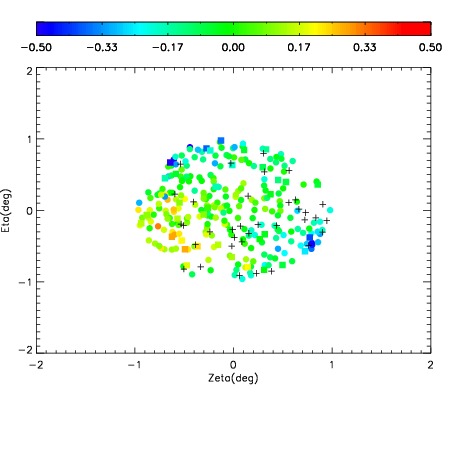
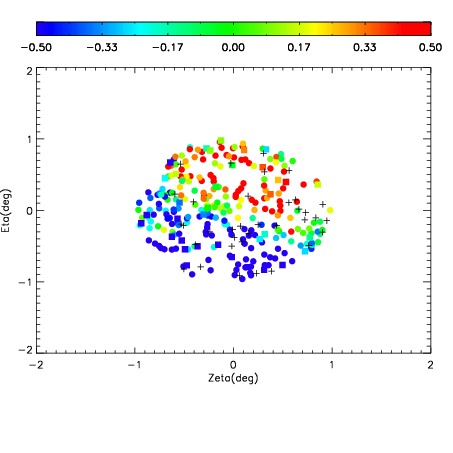
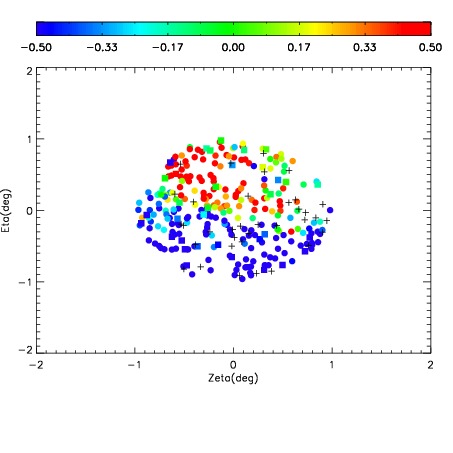
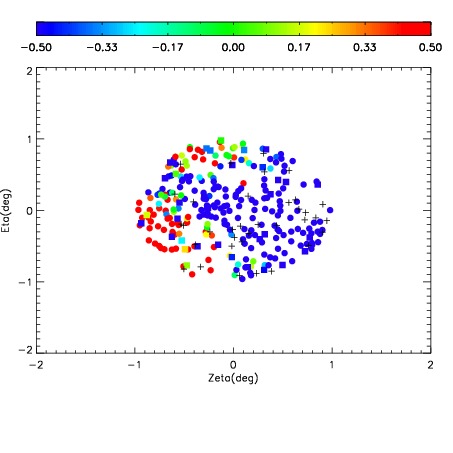
| Spatial sky 16325A emission deviations (filled: sky, open: star)
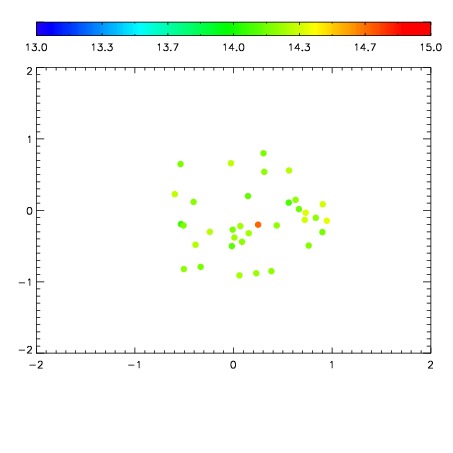
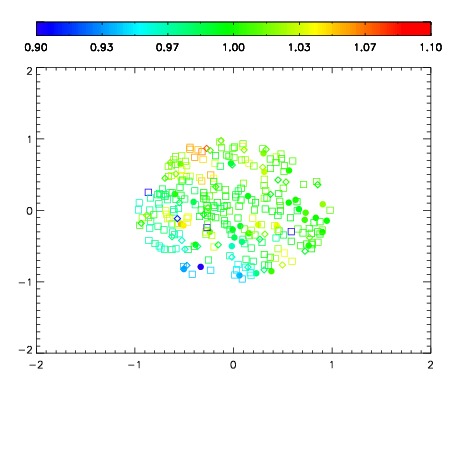
| Spatial sky continuum emission
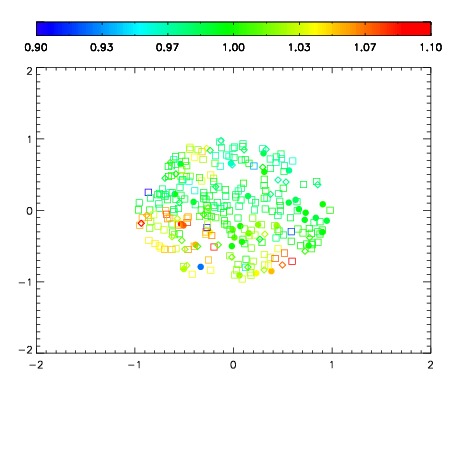
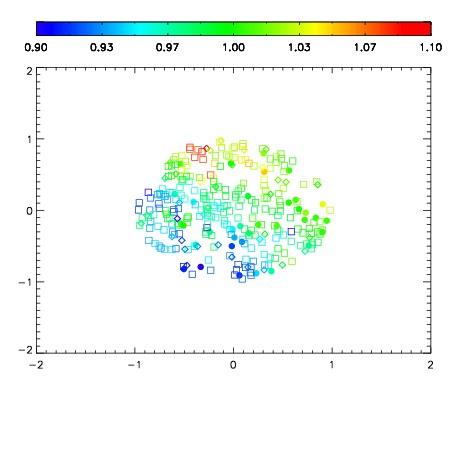
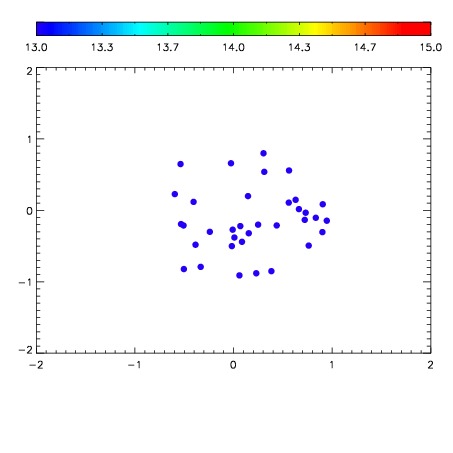
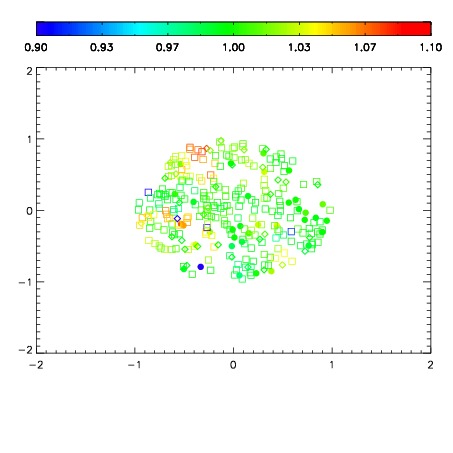
| Spatial sky telluric CO2 absorption deviations (filled: H < 10)
|
| 2480031
| 47
| | Red | Green | Blue
| | z | | 18.77
| | znorm | | 14.59
| | sky | 14.3 | 14.3 | 13.5
| | S/N | 14.2 | 22.5 | 20.9
| | S/N(c) | 12.7 | 20.7 | 21.1
| | SN(E/C) 0.69
|
| 
| 
| 
| 
| 
|
| 2480032
| 47
| | Red | Green | Blue
| | z | | 18.70
| | znorm | | 14.52
| | sky | 14.4 | 14.2 | 13.6
| | S/N | 13.4 | 21.6 | 20.5
| | S/N(c) | 12.0 | 19.8 | 20.5
| | SN(E/C) 0.70
|
| 
| 
| 
| 
| 
|
| 2480033
| 47
| | Red | Green | Blue
| | z | | 18.55
| | znorm | | 14.37
| | sky | 14.4 | 14.2 | 13.6
| | S/N | 12.3 | 20.0 | 18.9
| | S/N(c) | 10.8 | 18.4 | 19.0
| | SN(E/C) 0.72
|
| 
| 
| 
| 
| 
|
| 2480034
| 47
| | Red | Green | Blue
| | z | | 18.53
| | znorm | | 14.35
| | sky | 14.2 | 14.1 | 13.6
| | S/N | 11.9 | 19.5 | 18.7
| | S/N(c) | 10.4 | 17.7 | 18.5
| | SN(E/C) 0.77
|
| 
| 
| 
| 
| 
|
| 2480035
| 47
| | Red | Green | Blue
| | z | | 17.56
| | znorm | | 13.38
| | sky | 12.4 | 12.3 | 12.2
| | S/N | 4.7 | 8.0 | 6.9
| | S/N(c) | 4.0 | 6.5 | 7.1
| | SN(E/C) 0.90
|
| 
| 
| 
| 
| 
|
| 2480036
| 47
| | Red | Green | Blue
| | z | | 15.69
| | znorm | | 11.51
| | sky | 12.2 | 12.1 | 12.0
| | S/N | 0.8 | 1.5 | 0.6
| | S/N(c) | 0.6 | 1.1 | 1.3
| | SN(E/C) 0.93
|
| 
| 
| 
| 
| 
|
| 2480037
| 47
| | Red | Green | Blue
| | z | | 15.08
| | znorm | | 10.90
| | sky | 12.2 | 12.2 | 12.1
| | S/N | 0.4 | 1.0 | 0.0
| | S/N(c) | 0.0 | 0.0 | 0.0
| | SN(E/C) 3.90
|
| 
| 
| 
| 
| 
|
| 2480038
| 47
| | Red | Green | Blue
| | z | | 13.82
| | znorm | | 9.64
| | sky | 13.0 | 12.9 | 12.7
| | S/N | -0.0 | 0.0 | -2.4
| | S/N(c) | 0.0 | 0.0 | 0.0
| | SN(E/C) 8.28
|
| 
| 
| 
| 
| 
|

