| Red | Green | Blue | |
| z | 17.64 | ||
| znorm | Inf | ||
| sky | -Inf | -Inf | -Inf |
| S/N | 15.9 | 26.6 | 27.7 |
| S/N(c) | 0.0 | 0.0 | 0.0 |
| SN(E/C) |

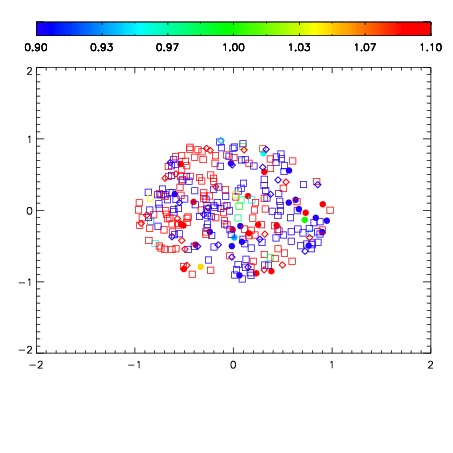
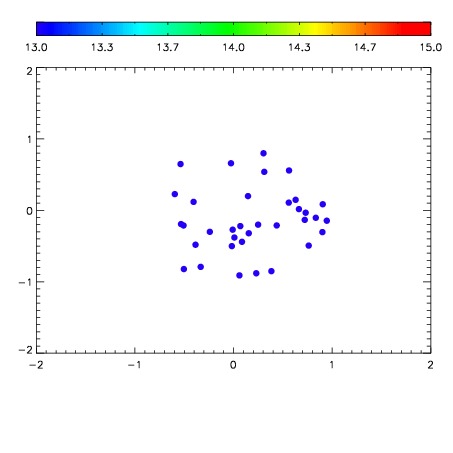

| Frame | Nreads | Zeropoints | Mag plots | Spatial mag deviation | Spatial sky 16325A emission deviations (filled: sky, open: star) | Spatial sky continuum emission | Spatial sky telluric CO2 absorption deviations (filled: H < 10) | |||||||||||||||||||||||
| 0 | 0 |
|
|
|
|
|
|
| IPAIR | NAME | SHIFT | NEWSHIFT | S/N | NAME | SHIFT | NEWSHIFT | S/N |
| 0 | 02480036 | 0.421453 | 0.00000 | 18.8943 | 02480035 | -0.00241990 | 0.423873 | 117.153 |
| 1 | 02480032 | 0.416562 | 0.00489101 | 183.450 | 02480031 | 0.00000 | 0.421453 | 186.859 |
| 2 | 02480033 | 0.418447 | 0.00300601 | 172.182 | 02480034 | 0.000352306 | 0.421101 | 169.624 |