| Red | Green | Blue | |
| z | 17.64 | ||
| znorm | Inf | ||
| sky | -Inf | -Inf | -Inf |
| S/N | 19.6 | 32.3 | 35.5 |
| S/N(c) | 0.0 | 0.0 | 0.0 |
| SN(E/C) |
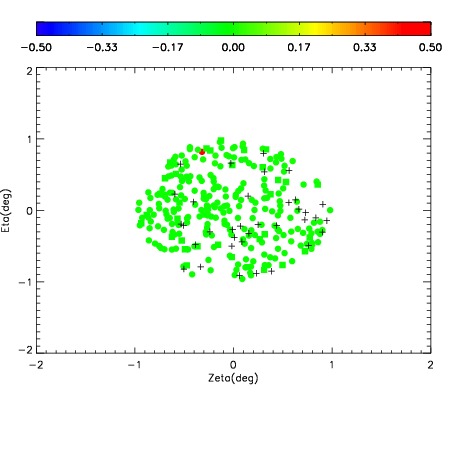
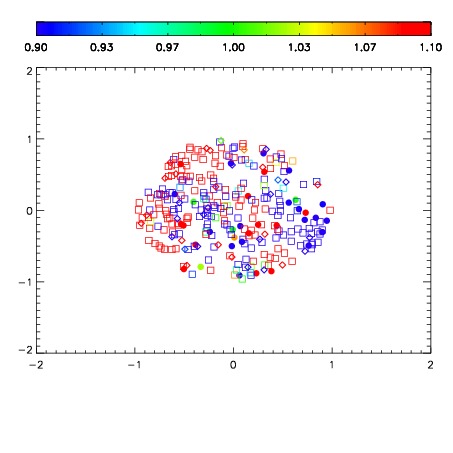
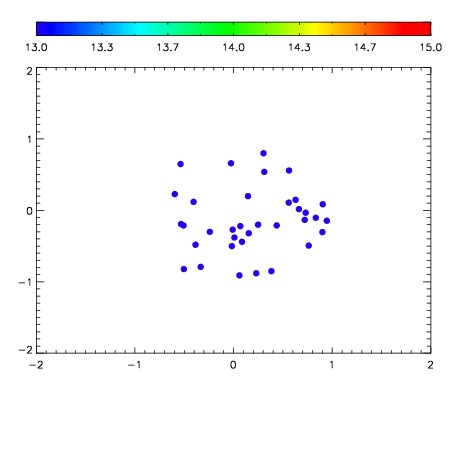

| Frame | Nreads | Zeropoints | Mag plots | Spatial mag deviation | Spatial sky 16325A emission deviations (filled: sky, open: star) | Spatial sky continuum emission | Spatial sky telluric CO2 absorption deviations (filled: H < 10) | |||||||||||||||||||||||
| 0 | 0 |
|
|
|
|
|
|
| IPAIR | NAME | SHIFT | NEWSHIFT | S/N | NAME | SHIFT | NEWSHIFT | S/N |
| 0 | 02490033 | 0.418900 | 0.00000 | 171.745 | 02490038 | 0.00147083 | 0.417429 | 172.964 |
| 1 | 02490032 | 0.418142 | 0.000758022 | 193.059 | 02490031 | 0.00000 | 0.418900 | 186.063 |
| 2 | 02490036 | 0.414341 | 0.00455901 | 183.775 | 02490035 | -0.000903708 | 0.419804 | 183.908 |
| 3 | 02490037 | 0.415158 | 0.00374201 | 171.633 | 02490034 | 0.00259543 | 0.416305 | 170.108 |
| 4 | 02490040 | 0.414108 | 0.00479200 | 164.248 | 02490039 | -0.00145993 | 0.420360 | 157.321 |
| 5 | 02490041 | 0.414376 | 0.00452402 | 161.893 | 02490042 | -0.00159134 | 0.420491 | 151.315 |