| Red | Green | Blue | |
| z | 17.64 | ||
| znorm | Inf | ||
| sky | -Inf | -Inf | -Inf |
| S/N | 14.0 | 26.2 | 29.5 |
| S/N(c) | 0.0 | 0.0 | 0.0 |
| SN(E/C) |
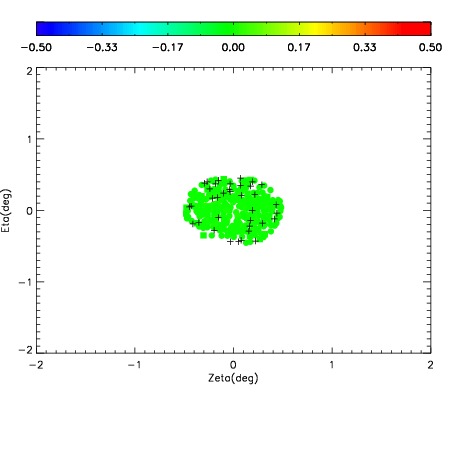

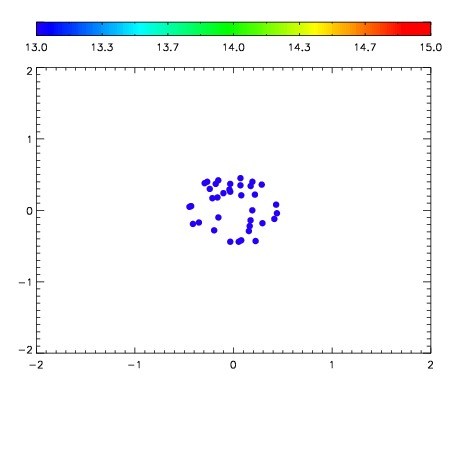

| Frame | Nreads | Zeropoints | Mag plots | Spatial mag deviation | Spatial sky 16325A emission deviations (filled: sky, open: star) | Spatial sky continuum emission | Spatial sky telluric CO2 absorption deviations (filled: H < 10) | |||||||||||||||||||||||
| 0 | 0 |
|
|
|
|
|
|
| IPAIR | NAME | SHIFT | NEWSHIFT | S/N | NAME | SHIFT | NEWSHIFT | S/N |
| 0 | 02540017 | 0.409621 | 0.00000 | 146.627 | 02540011 | 0.00000 | 0.409621 | 129.113 |
| 1 | 02540012 | 0.407413 | 0.00220799 | 115.531 | 02540018 | 0.00366298 | 0.405958 | 119.328 |
| 2 | 02540013 | 0.409280 | 0.000340998 | 114.791 | 02540014 | 0.00357905 | 0.406042 | 108.687 |
| 3 | 02540016 | 0.409182 | 0.000438988 | 91.6537 | 02540015 | 0.00196006 | 0.407661 | 94.6779 |