| Red | Green | Blue | |
| z | 17.64 | ||
| znorm | Inf | ||
| sky | -Inf | -Inf | -Inf |
| S/N | 9.6 | 17.2 | 18.7 |
| S/N(c) | 0.0 | 0.0 | 0.0 |
| SN(E/C) |
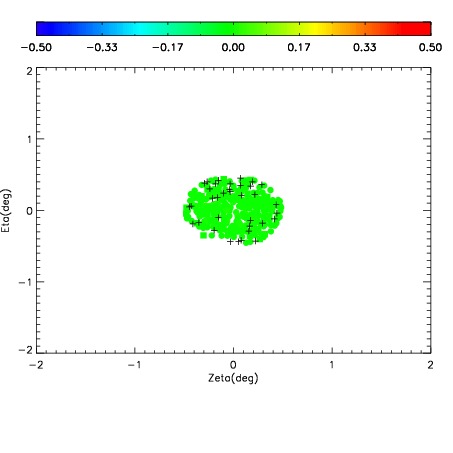
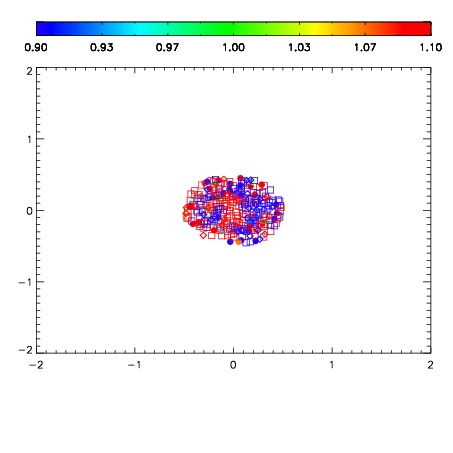
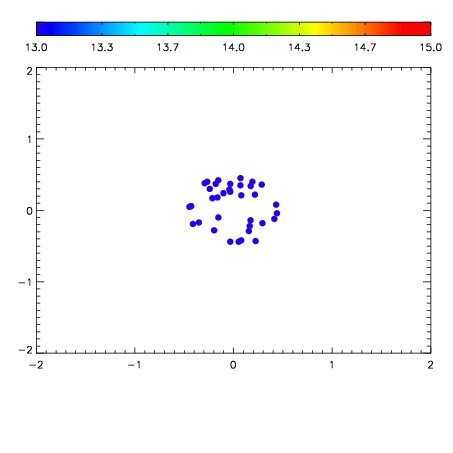

| Frame | Nreads | Zeropoints | Mag plots | Spatial mag deviation | Spatial sky 16325A emission deviations (filled: sky, open: star) | Spatial sky continuum emission | Spatial sky telluric CO2 absorption deviations (filled: H < 10) | |||||||||||||||||||||||
| 0 | 0 |
|
|
|
|
|
|
| IPAIR | NAME | SHIFT | NEWSHIFT | S/N | NAME | SHIFT | NEWSHIFT | S/N |
| 0 | 05210065 | 0.501098 | 0.00000 | 110.660 | 05210062 | 0.00444297 | 0.496655 | 109.604 |
| 1 | 05210064 | 0.500853 | 0.000244975 | 112.345 | 05210063 | 0.00346733 | 0.497631 | 120.254 |
| 2 | 05210060 | 0.499393 | 0.00170499 | 110.609 | 05210066 | 0.00514730 | 0.495951 | 99.0020 |
| 3 | 05210061 | 0.500791 | 0.000306964 | 107.715 | 05210059 | 0.00000 | 0.501098 | 94.2027 |