| Red | Green | Blue | |
| z | 17.64 | ||
| znorm | Inf | ||
| sky | -Inf | -Inf | -Inf |
| S/N | 23.2 | 39.1 | 40.8 |
| S/N(c) | 0.0 | 0.0 | 0.0 |
| SN(E/C) |
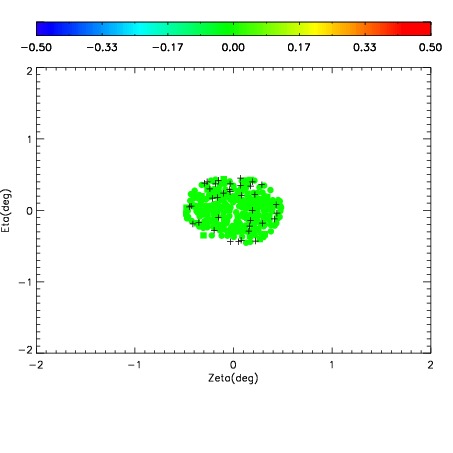
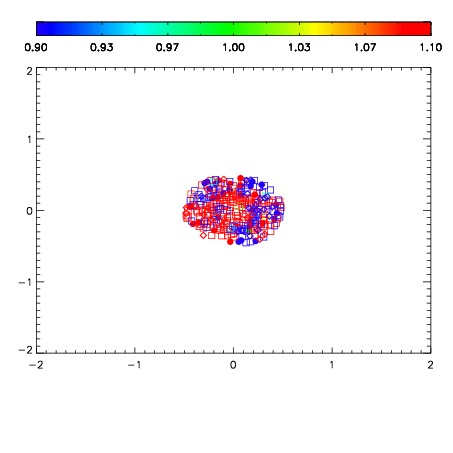
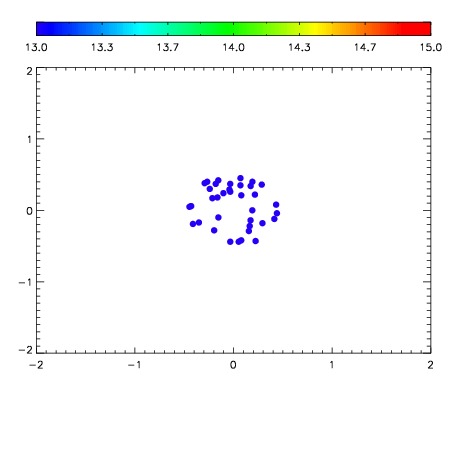

| Frame | Nreads | Zeropoints | Mag plots | Spatial mag deviation | Spatial sky 16325A emission deviations (filled: sky, open: star) | Spatial sky continuum emission | Spatial sky telluric CO2 absorption deviations (filled: H < 10) | |||||||||||||||||||||||
| 0 | 0 |
|
|
|
|
|
|
| IPAIR | NAME | SHIFT | NEWSHIFT | S/N | NAME | SHIFT | NEWSHIFT | S/N |
| 0 | 05260034 | 0.494866 | 0.00000 | 160.253 | 05260032 | 0.00331978 | 0.491546 | 162.048 |
| 1 | 05260033 | 0.493602 | 0.00126401 | 159.827 | 05260035 | 0.00582481 | 0.489041 | 160.194 |
| 2 | 05260030 | 0.494565 | 0.000301003 | 138.059 | 05260028 | 0.00000 | 0.494866 | 145.275 |
| 3 | 05260029 | 0.494129 | 0.000737011 | 136.895 | 05260031 | 0.00406468 | 0.490801 | 145.239 |