| Red | Green | Blue | |
| z | 17.64 | ||
| znorm | Inf | ||
| sky | -Inf | -Inf | -Inf |
| S/N | 27.8 | 47.5 | 47.8 |
| S/N(c) | 0.0 | 0.0 | 0.0 |
| SN(E/C) |
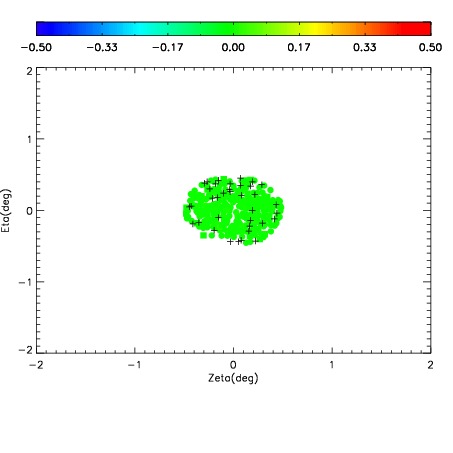
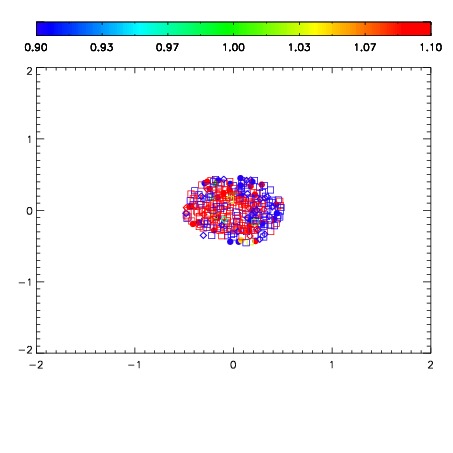
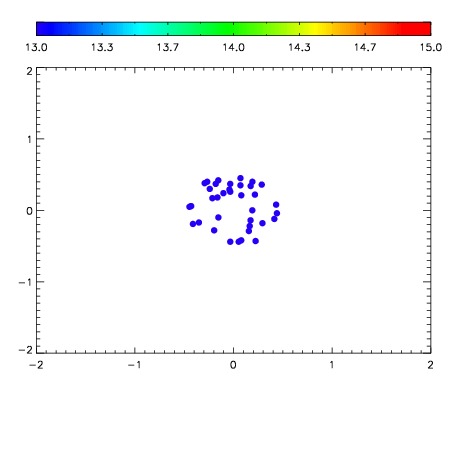

| Frame | Nreads | Zeropoints | Mag plots | Spatial mag deviation | Spatial sky 16325A emission deviations (filled: sky, open: star) | Spatial sky continuum emission | Spatial sky telluric CO2 absorption deviations (filled: H < 10) | |||||||||||||||||||||||
| 0 | 0 |
|
|
|
|
|
|
| IPAIR | NAME | SHIFT | NEWSHIFT | S/N | NAME | SHIFT | NEWSHIFT | S/N |
| 0 | 06110016 | 0.485399 | 0.00000 | 189.213 | 06110017 | 0.000774437 | 0.484625 | 187.706 |
| 1 | 06110015 | 0.483857 | 0.00154200 | 182.109 | 06110014 | 0.00118712 | 0.484212 | 181.158 |
| 2 | 06110011 | 0.483126 | 0.00227299 | 173.048 | 06110013 | 0.000719199 | 0.484680 | 179.225 |
| 3 | 06110012 | 0.484230 | 0.00116900 | 171.350 | 06110010 | 0.00000 | 0.485399 | 166.164 |