| Red | Green | Blue | |
| z | 17.64 | ||
| znorm | Inf | ||
| sky | -NaN | -Inf | -Inf |
| S/N | 16.7 | 31.2 | 34.6 |
| S/N(c) | 0.0 | 0.0 | 0.0 |
| SN(E/C) |
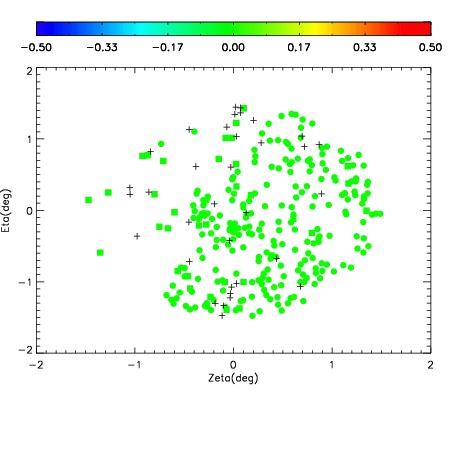
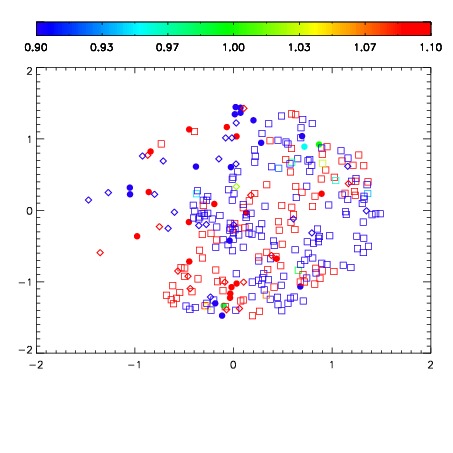
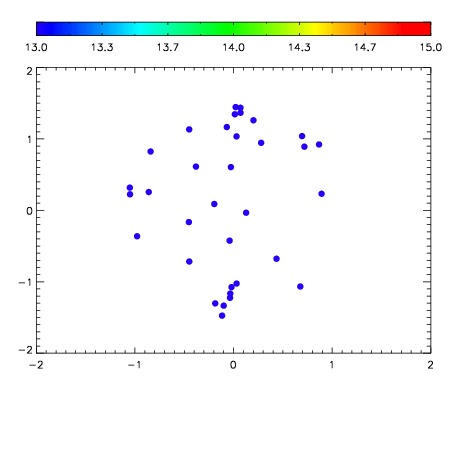

| Frame | Nreads | Zeropoints | Mag plots | Spatial mag deviation | Spatial sky 16325A emission deviations (filled: sky, open: star) | Spatial sky continuum emission | Spatial sky telluric CO2 absorption deviations (filled: H < 10) | |||||||||||||||||||||||
| 0 | 0 |
|
|
|
|
|
|
| IPAIR | NAME | SHIFT | NEWSHIFT | S/N | NAME | SHIFT | NEWSHIFT | S/N |
| 0 | 02530019 | 0.416179 | 0.00000 | 173.224 | 02530017 | 0.00000 | 0.416179 | 185.534 |
| 1 | 02530023 | 0.412474 | 0.00370499 | 202.741 | 02530020 | 0.00101182 | 0.415167 | 205.195 |
| 2 | 02530022 | 0.412002 | 0.00417700 | 201.480 | 02530021 | -0.000100314 | 0.416279 | 201.514 |
| 3 | 02530018 | 0.414370 | 0.00180900 | 179.363 | 02530024 | 0.000281032 | 0.415898 | 190.654 |