| Red | Green | Blue | |
| z | 17.64 | ||
| znorm | Inf | ||
| sky | -Inf | -Inf | -Inf |
| S/N | 13.8 | 28.7 | 34.1 |
| S/N(c) | 0.0 | 0.0 | 0.0 |
| SN(E/C) |
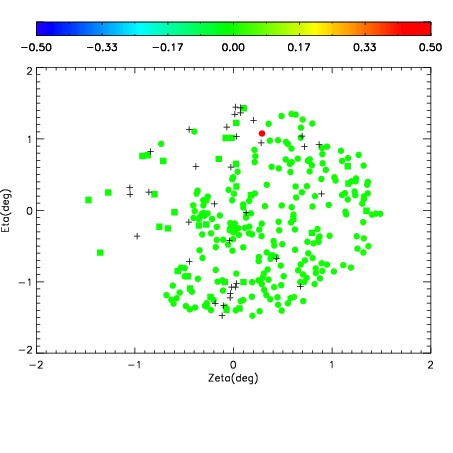
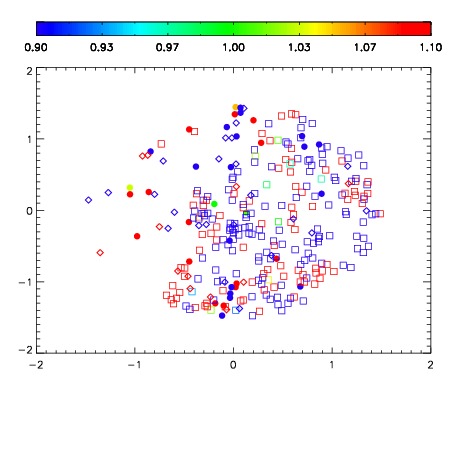
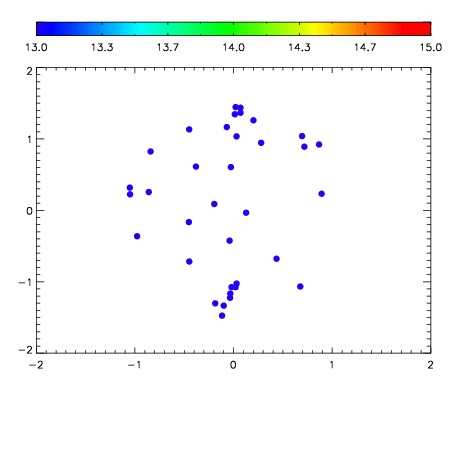

| Frame | Nreads | Zeropoints | Mag plots | Spatial mag deviation | Spatial sky 16325A emission deviations (filled: sky, open: star) | Spatial sky continuum emission | Spatial sky telluric CO2 absorption deviations (filled: H < 10) | |||||||||||||||||||||||
| 0 | 0 |
|
|
|
|
|
|
| IPAIR | NAME | SHIFT | NEWSHIFT | S/N | NAME | SHIFT | NEWSHIFT | S/N |
| 0 | 02600065 | 0.420490 | 0.00000 | 191.596 | 02600066 | -0.00206935 | 0.422559 | 194.764 |
| 1 | 02600064 | 0.419469 | 0.00102100 | 193.548 | 02600063 | -0.000956234 | 0.421446 | 199.046 |
| 2 | 02600061 | 0.419289 | 0.00120100 | 187.474 | 02600062 | -0.000655327 | 0.421145 | 192.758 |
| 3 | 02600060 | 0.418856 | 0.00163400 | 177.304 | 02600059 | 0.00000 | 0.420490 | 166.564 |