| Red | Green | Blue | |
| z | 17.64 | ||
| znorm | Inf | ||
| sky | -Inf | -Inf | -Inf |
| S/N | 17.0 | 32.2 | 34.7 |
| S/N(c) | 0.0 | 0.0 | 0.0 |
| SN(E/C) |
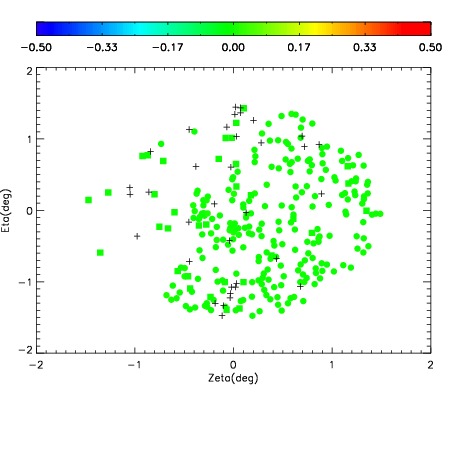
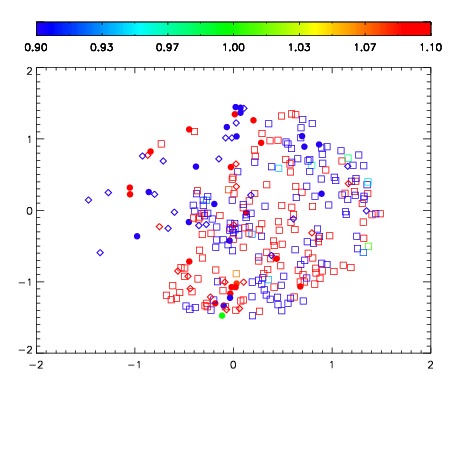
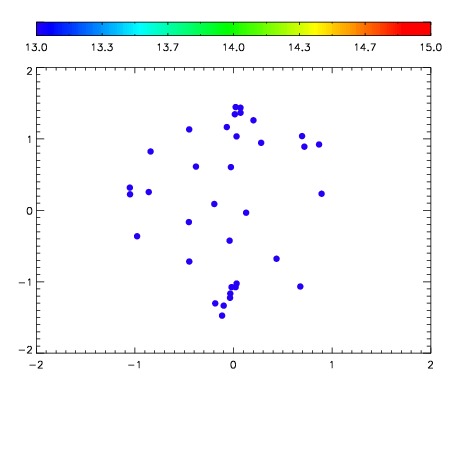

| Frame | Nreads | Zeropoints | Mag plots | Spatial mag deviation | Spatial sky 16325A emission deviations (filled: sky, open: star) | Spatial sky continuum emission | Spatial sky telluric CO2 absorption deviations (filled: H < 10) | |||||||||||||||||||||||
| 0 | 0 |
|
|
|
|
|
|
| IPAIR | NAME | SHIFT | NEWSHIFT | S/N | NAME | SHIFT | NEWSHIFT | S/N |
| 0 | 02790042 | 0.424737 | 0.00000 | 196.150 | 02790039 | -0.00146089 | 0.426198 | 189.384 |
| 1 | 02790038 | 0.421486 | 0.00325102 | 209.354 | 02790043 | -0.000121169 | 0.424858 | 213.173 |
| 2 | 02790041 | 0.416043 | 0.00869399 | 187.379 | 02790040 | -0.00344346 | 0.428180 | 177.807 |
| 3 | 02790037 | 0.417295 | 0.00744200 | 169.664 | 02790036 | 0.00000 | 0.424737 | 149.659 |