| Red | Green | Blue | |
| z | 17.64 | ||
| znorm | Inf | ||
| sky | -Inf | -Inf | -Inf |
| S/N | 25.4 | 44.1 | 49.1 |
| S/N(c) | 0.0 | 0.0 | 0.0 |
| SN(E/C) |
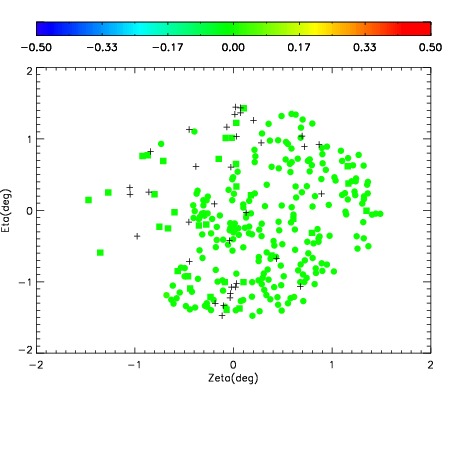
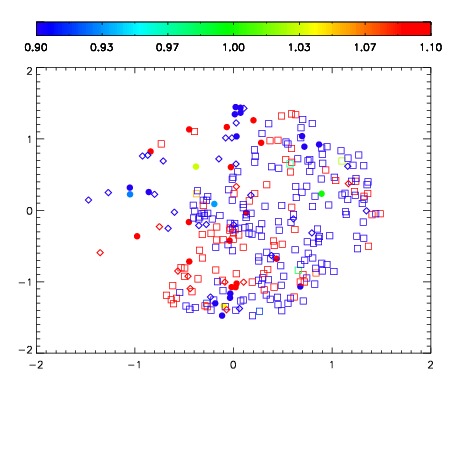
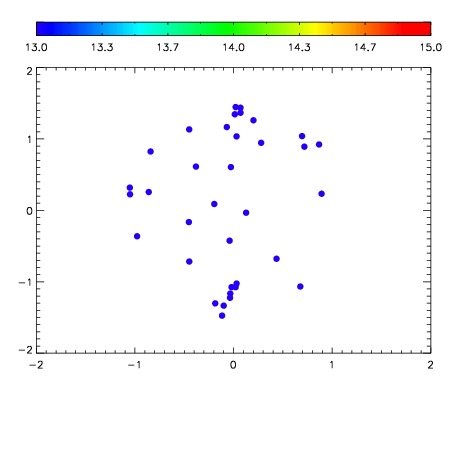

| Frame | Nreads | Zeropoints | Mag plots | Spatial mag deviation | Spatial sky 16325A emission deviations (filled: sky, open: star) | Spatial sky continuum emission | Spatial sky telluric CO2 absorption deviations (filled: H < 10) | |||||||||||||||||||||||
| 0 | 0 |
|
|
|
|
|
|
| IPAIR | NAME | SHIFT | NEWSHIFT | S/N | NAME | SHIFT | NEWSHIFT | S/N |
| 0 | 03040040 | 0.498506 | 0.00000 | 234.195 | 03040038 | -0.00207136 | 0.500577 | 235.479 |
| 1 | 03040036 | 0.497983 | 0.000523001 | 235.582 | 03040037 | -0.00131867 | 0.499825 | 236.728 |
| 2 | 03040035 | 0.497807 | 0.000699013 | 230.785 | 03040041 | 0.000807141 | 0.497699 | 234.470 |
| 3 | 03040039 | 0.496880 | 0.00162601 | 227.882 | 03040034 | 0.00000 | 0.498506 | 228.082 |