| Red | Green | Blue | |
| z | 17.64 | ||
| znorm | Inf | ||
| sky | -Inf | -Inf | -Inf |
| S/N | 19.7 | 36.6 | 40.6 |
| S/N(c) | 0.0 | 0.0 | 0.0 |
| SN(E/C) |
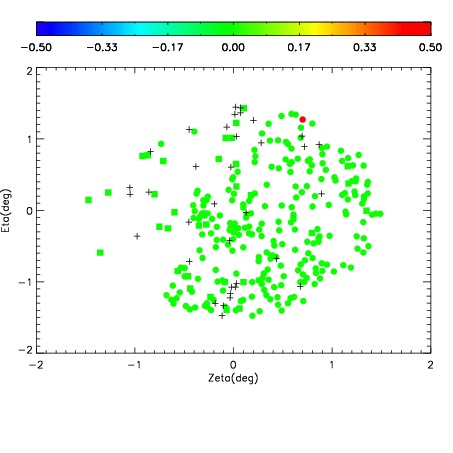

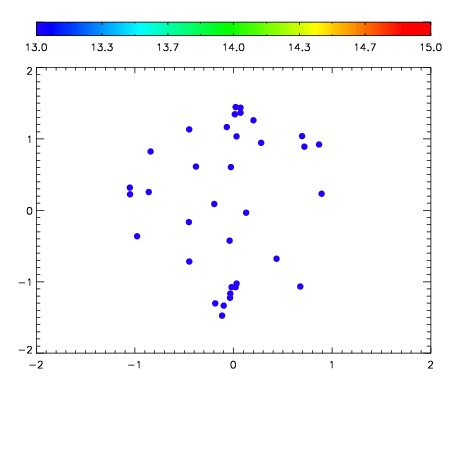

| Frame | Nreads | Zeropoints | Mag plots | Spatial mag deviation | Spatial sky 16325A emission deviations (filled: sky, open: star) | Spatial sky continuum emission | Spatial sky telluric CO2 absorption deviations (filled: H < 10) | |||||||||||||||||||||||
| 0 | 0 |
|
|
|
|
|
|
| IPAIR | NAME | SHIFT | NEWSHIFT | S/N | NAME | SHIFT | NEWSHIFT | S/N |
| 0 | 03140040 | 0.505450 | 0.00000 | 143.826 | 03140041 | 0.000440229 | 0.505010 | 131.989 |
| 1 | 03140035 | 0.497013 | 0.00843701 | 180.063 | 03140034 | 0.00000 | 0.505450 | 187.477 |
| 2 | 03140036 | 0.497571 | 0.00787902 | 178.107 | 03140038 | 0.000475261 | 0.504975 | 181.113 |
| 3 | 03140039 | 0.502909 | 0.00254101 | 175.165 | 03140037 | 0.00149976 | 0.503950 | 175.492 |
| 4 | 03140043 | 0.502549 | 0.00290102 | 155.195 | 03140042 | -0.00173214 | 0.507182 | 145.615 |