| Red | Green | Blue | |
| z | 17.64 | ||
| znorm | Inf | ||
| sky | -Inf | -NaN | -Inf |
| S/N | 23.6 | 40.9 | 43.2 |
| S/N(c) | 0.0 | 0.0 | 0.0 |
| SN(E/C) |
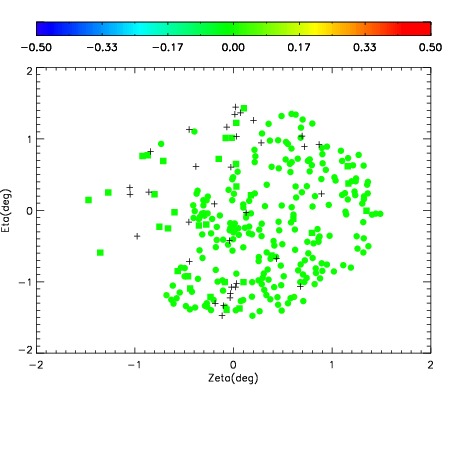
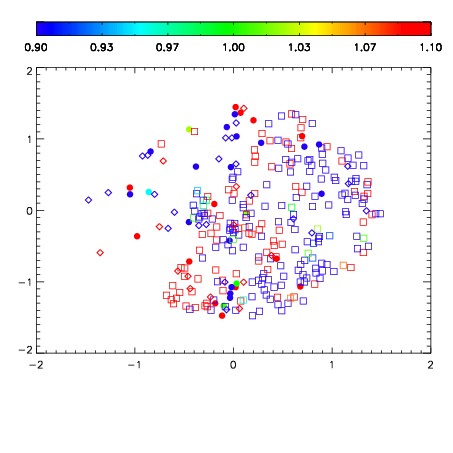


| Frame | Nreads | Zeropoints | Mag plots | Spatial mag deviation | Spatial sky 16325A emission deviations (filled: sky, open: star) | Spatial sky continuum emission | Spatial sky telluric CO2 absorption deviations (filled: H < 10) | |||||||||||||||||||||||
| 0 | 0 |
|
|
|
|
|
|
| IPAIR | NAME | SHIFT | NEWSHIFT | S/N | NAME | SHIFT | NEWSHIFT | S/N |
| 0 | 10910013 | 0.512159 | 0.00000 | 223.578 | 10910018 | -0.00106332 | 0.513222 | 221.199 |
| 1 | 10910012 | 0.511627 | 0.000531971 | 230.427 | 10910015 | -0.000854676 | 0.513014 | 236.482 |
| 2 | 10910017 | 0.510980 | 0.00117898 | 226.723 | 10910014 | -0.000867492 | 0.513026 | 227.996 |
| 3 | 10910016 | 0.509384 | 0.00277501 | 221.885 | 10910011 | 0.00000 | 0.512159 | 212.669 |