| Red | Green | Blue | |
| z | 17.64 | ||
| znorm | Inf | ||
| sky | -Inf | -NaN | -Inf |
| S/N | 22.7 | 39.5 | 41.6 |
| S/N(c) | 0.0 | 0.0 | 0.0 |
| SN(E/C) |
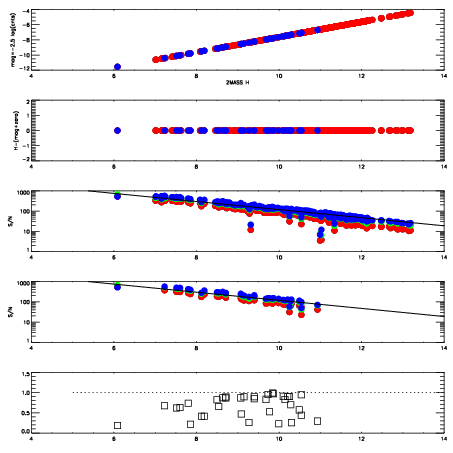
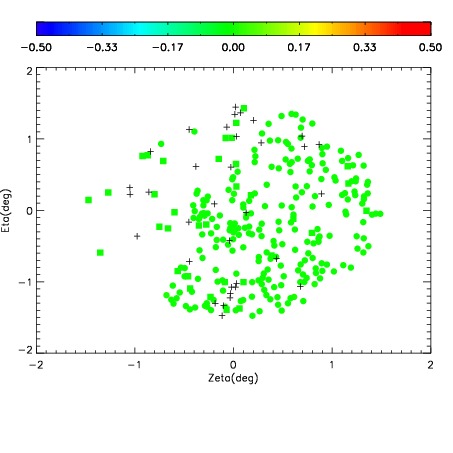
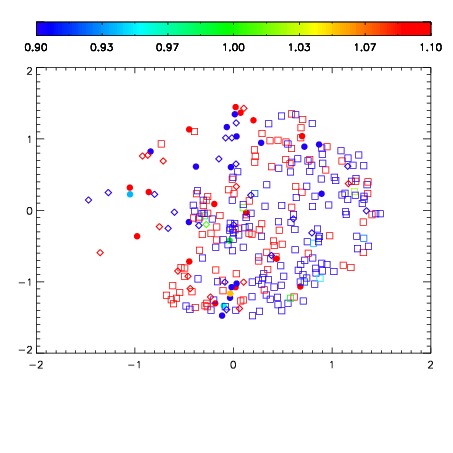
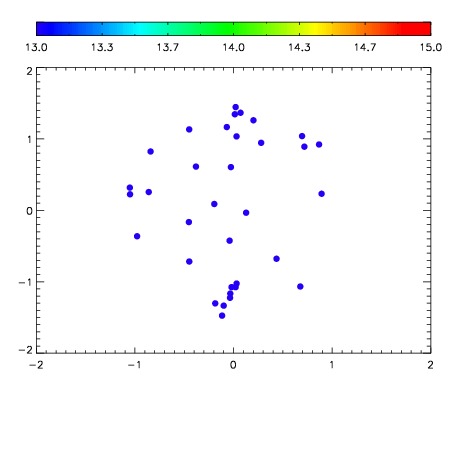

| Frame | Nreads | Zeropoints | Mag plots | Spatial mag deviation | Spatial sky 16325A emission deviations (filled: sky, open: star) | Spatial sky continuum emission | Spatial sky telluric CO2 absorption deviations (filled: H < 10) | |||||||||||||||||||||||
| 0 | 0 |
|
|
|
|
|
|
| IPAIR | NAME | SHIFT | NEWSHIFT | S/N | NAME | SHIFT | NEWSHIFT | S/N |
| 0 | 10920017 | 0.515662 | 0.00000 | 226.147 | 10920014 | -0.00421436 | 0.519876 | 220.603 |
| 1 | 10920016 | 0.515235 | 0.000427008 | 248.241 | 10920015 | -0.00433757 | 0.520000 | 238.030 |
| 2 | 10920013 | 0.514662 | 0.000999987 | 212.257 | 10920011 | 0.00000 | 0.515662 | 215.290 |
| 3 | 10920012 | 0.515254 | 0.000407994 | 194.395 | 10920018 | -0.00395170 | 0.519614 | 212.728 |