| Red | Green | Blue | |
| z | 17.64 | ||
| znorm | Inf | ||
| sky | -NaN | -Inf | -Inf |
| S/N | 18.1 | 33.5 | 34.7 |
| S/N(c) | 0.0 | 0.0 | 0.0 |
| SN(E/C) |
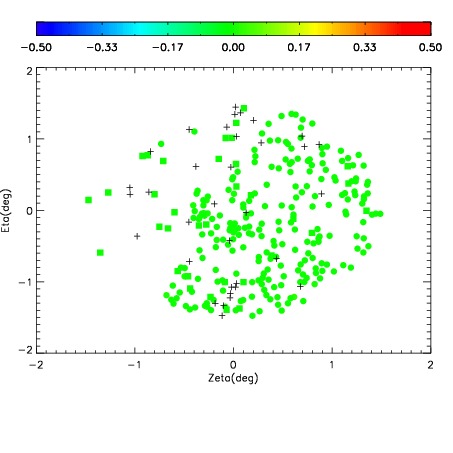

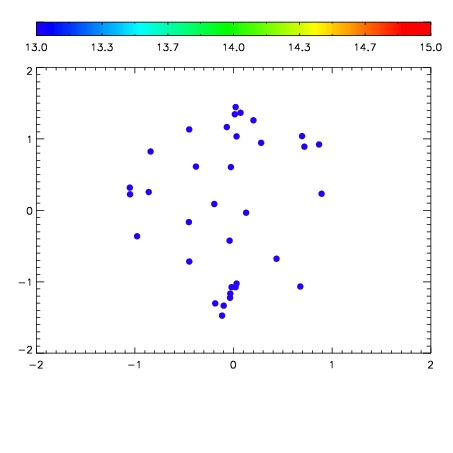

| Frame | Nreads | Zeropoints | Mag plots | Spatial mag deviation | Spatial sky 16325A emission deviations (filled: sky, open: star) | Spatial sky continuum emission | Spatial sky telluric CO2 absorption deviations (filled: H < 10) | |||||||||||||||||||||||
| 0 | 0 |
|
|
|
|
|
|
| IPAIR | NAME | SHIFT | NEWSHIFT | S/N | NAME | SHIFT | NEWSHIFT | S/N |
| 0 | 10930017 | 0.513844 | 0.00000 | 149.593 | 10930015 | -0.00440362 | 0.518248 | 143.954 |
| 1 | 10930012 | 0.509465 | 0.00437903 | 223.235 | 10930011 | 0.00000 | 0.513844 | 218.489 |
| 2 | 10930013 | 0.509717 | 0.00412703 | 219.222 | 10930014 | -0.00545109 | 0.519295 | 210.143 |
| 3 | 10930016 | 0.511992 | 0.00185204 | 154.696 | 10930018 | -0.00129228 | 0.515136 | 167.645 |