| Red | Green | Blue | |
| z | 17.64 | ||
| znorm | Inf | ||
| sky | -NaN | -NaN | -Inf |
| S/N | 25.0 | 43.8 | 46.5 |
| S/N(c) | 0.0 | 0.0 | 0.0 |
| SN(E/C) |
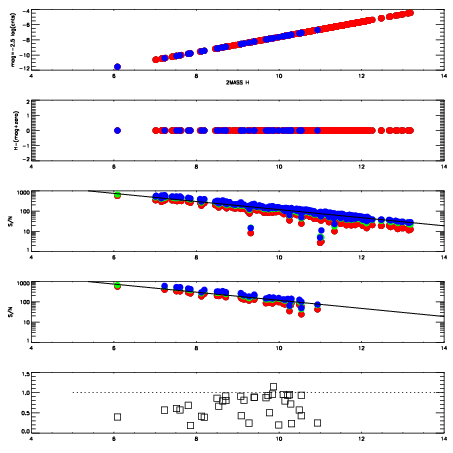
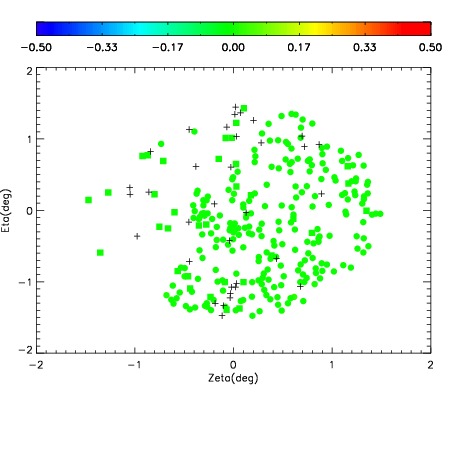
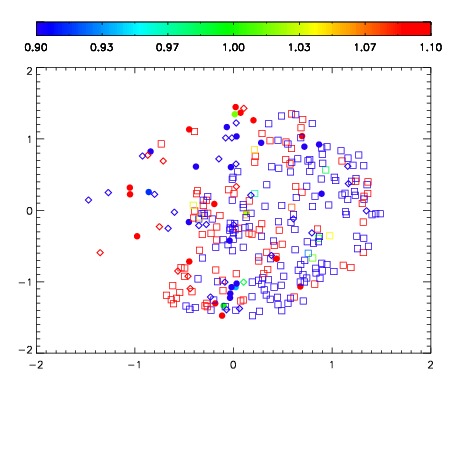
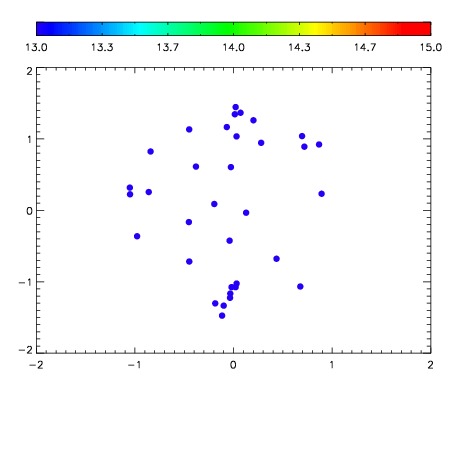

| Frame | Nreads | Zeropoints | Mag plots | Spatial mag deviation | Spatial sky 16325A emission deviations (filled: sky, open: star) | Spatial sky continuum emission | Spatial sky telluric CO2 absorption deviations (filled: H < 10) | |||||||||||||||||||||||
| 0 | 0 |
|
|
|
|
|
|
| IPAIR | NAME | SHIFT | NEWSHIFT | S/N | NAME | SHIFT | NEWSHIFT | S/N |
| 0 | 10940017 | 0.514416 | 0.00000 | 243.914 | 10940014 | -0.00254606 | 0.516962 | 243.631 |
| 1 | 10940013 | 0.512860 | 0.00155598 | 242.100 | 10940018 | -0.000996089 | 0.515412 | 241.335 |
| 2 | 10940012 | 0.512475 | 0.00194097 | 236.150 | 10940015 | -0.00152667 | 0.515943 | 235.083 |
| 3 | 10940016 | 0.512399 | 0.00201696 | 235.235 | 10940011 | 0.00000 | 0.514416 | 223.326 |