| Red | Green | Blue | |
| z | 17.64 | ||
| znorm | Inf | ||
| sky | -Inf | -Inf | -Inf |
| S/N | 30.1 | 45.4 | 52.6 |
| S/N(c) | 29.1 | 43.3 | 51.6 |
| SN(E/C) |

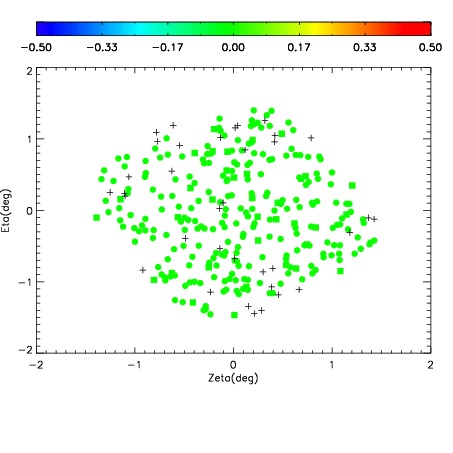
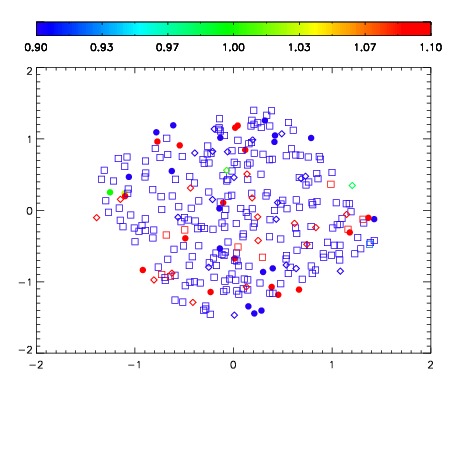
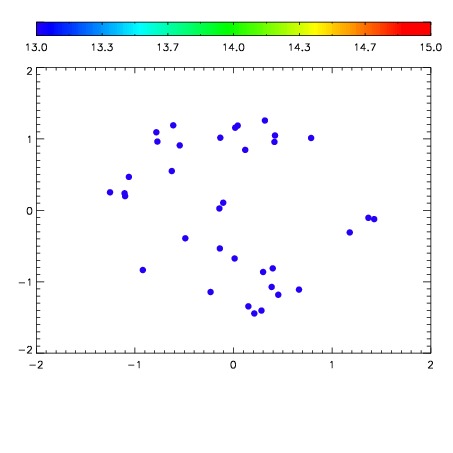

| Frame | Nreads | Zeropoints | Mag plots | Spatial mag deviation | Spatial sky 16325A emission deviations (filled: sky, open: star) | Spatial sky continuum emission | Spatial sky telluric CO2 absorption deviations (filled: H < 10) | |||||||||||||||||||||||
| 0 | 0 |
|
|
|
|
|
|
| IPAIR | NAME | SHIFT | NEWSHIFT | S/N | NAME | SHIFT | NEWSHIFT | S/N |
| 0 | 05150065 | 0.494623 | 0.00000 | 222.061 | 05150063 | 0.00000 | 0.494623 | 221.388 |
| 1 | 05150064 | 0.493911 | 0.000712007 | 224.110 | 05150067 | -0.000517443 | 0.495140 | 222.668 |
| 2 | 05150068 | 0.492409 | 0.00221401 | 221.957 | 05150066 | 0.000459334 | 0.494164 | 218.070 |