| Red | Green | Blue | |
| z | 17.64 | ||
| znorm | Inf | ||
| sky | -Inf | -Inf | -Inf |
| S/N | 31.8 | 45.9 | 48.2 |
| S/N(c) | 0.0 | 0.0 | 0.0 |
| SN(E/C) |

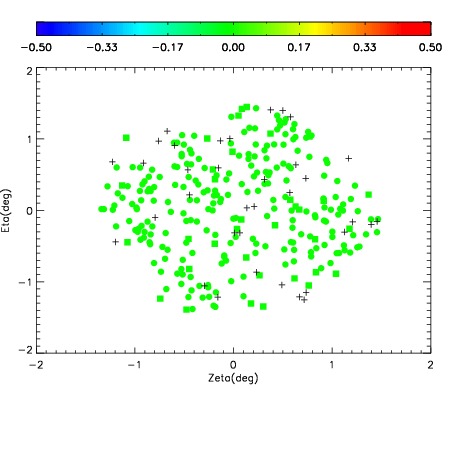
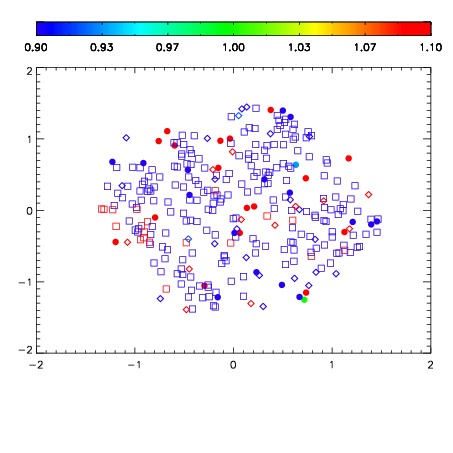
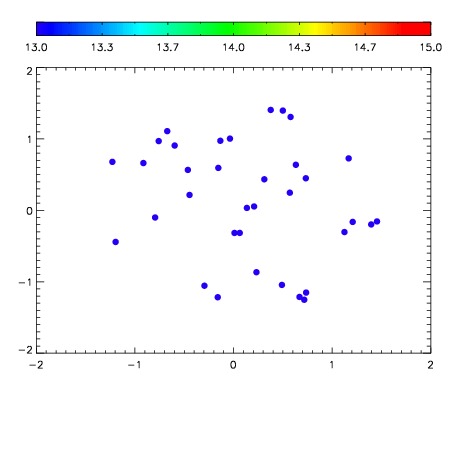

| Frame | Nreads | Zeropoints | Mag plots | Spatial mag deviation | Spatial sky 16325A emission deviations (filled: sky, open: star) | Spatial sky continuum emission | Spatial sky telluric CO2 absorption deviations (filled: H < 10) | |||||||||||||||||||||||
| 0 | 0 |
|
|
|
|
|
|
| IPAIR | NAME | SHIFT | NEWSHIFT | S/N | NAME | SHIFT | NEWSHIFT | S/N |
| 0 | 02820015 | 0.405015 | 0.00000 | 45.5367 | 02820013 | 0.000535165 | 0.404480 | 46.4810 |
| 1 | 02820010 | 0.403864 | 0.00115100 | 47.1512 | 02820016 | 0.00176966 | 0.403245 | 50.1329 |
| 2 | 02820011 | 0.404975 | 3.99947e-05 | 45.5482 | 02820009 | 0.00000 | 0.405015 | 48.6534 |
| 3 | 02820014 | 0.402689 | 0.00232598 | 45.0406 | 02820012 | 0.00210786 | 0.402907 | 44.8876 |