| Red | Green | Blue | |
| z | 17.64 | ||
| znorm | Inf | ||
| sky | -Inf | -NaN | -Inf |
| S/N | 17.8 | 29.3 | 37.0 |
| S/N(c) | 0.0 | 0.0 | 0.0 |
| SN(E/C) |
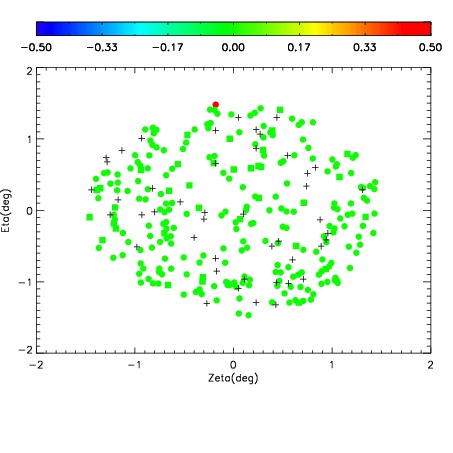
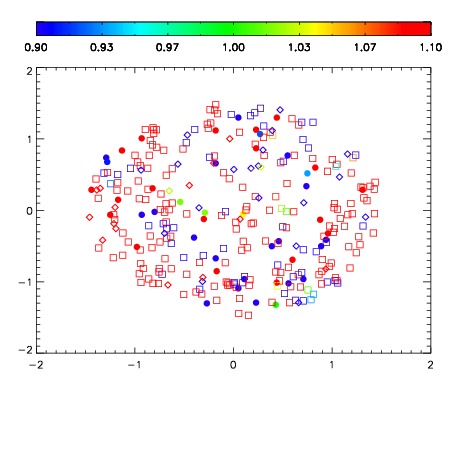
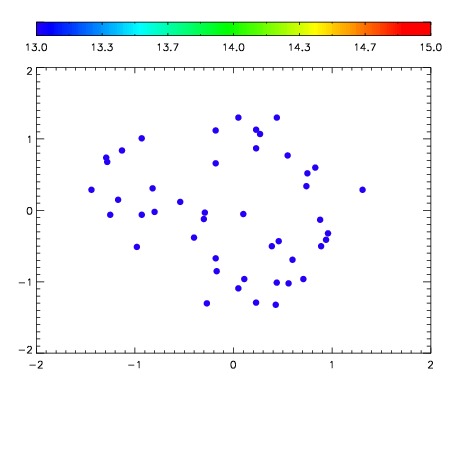

| Frame | Nreads | Zeropoints | Mag plots | Spatial mag deviation | Spatial sky 16325A emission deviations (filled: sky, open: star) | Spatial sky continuum emission | Spatial sky telluric CO2 absorption deviations (filled: H < 10) | |||||||||||||||||||||||
| 0 | 0 |
|
|
|
|
|
|
| IPAIR | NAME | SHIFT | NEWSHIFT | S/N | NAME | SHIFT | NEWSHIFT | S/N |
| 0 | 02560015 | 0.409531 | 0.00000 | 170.470 | 02560013 | 0.00000 | 0.409531 | 162.643 |
| 1 | 02560019 | 0.407926 | 0.00160500 | 175.511 | 02560016 | 0.00280265 | 0.406728 | 163.359 |
| 2 | 02560014 | 0.407539 | 0.00199199 | 152.886 | 02560017 | 0.00119623 | 0.408335 | 162.091 |
| 3 | 02560018 | 0.407501 | 0.00202999 | 145.517 | 02560020 | 0.00273097 | 0.406800 | 151.957 |