| Red | Green | Blue | |
| z | 17.64 | ||
| znorm | Inf | ||
| sky | -NaN | -NaN | -Inf |
| S/N | 29.0 | 43.6 | 51.8 |
| S/N(c) | 0.0 | 0.0 | 0.0 |
| SN(E/C) |
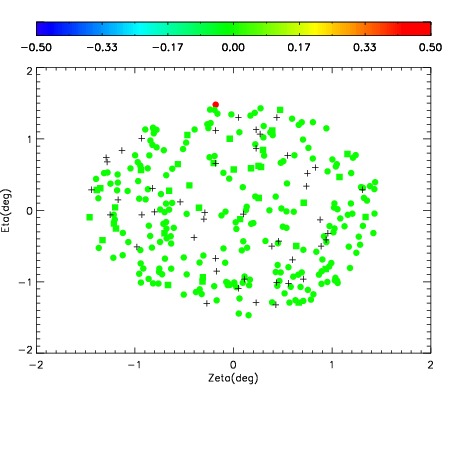
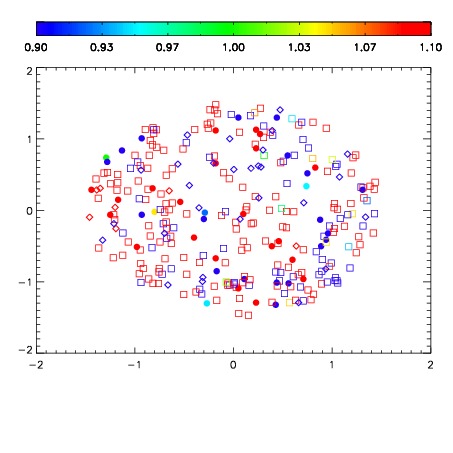
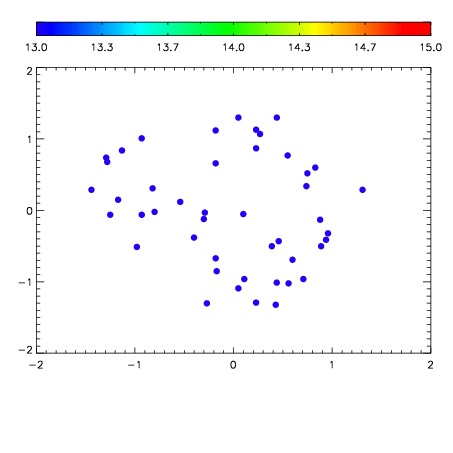

| Frame | Nreads | Zeropoints | Mag plots | Spatial mag deviation | Spatial sky 16325A emission deviations (filled: sky, open: star) | Spatial sky continuum emission | Spatial sky telluric CO2 absorption deviations (filled: H < 10) | |||||||||||||||||||||||
| 0 | 0 |
|
|
|
|
|
|
| IPAIR | NAME | SHIFT | NEWSHIFT | S/N | NAME | SHIFT | NEWSHIFT | S/N |
| 0 | 05220054 | 0.497901 | 0.00000 | 206.595 | 05220059 | 0.00129467 | 0.496606 | 211.503 |
| 1 | 05220058 | 0.495367 | 0.00253400 | 217.930 | 05220055 | -0.00298824 | 0.500889 | 218.874 |
| 2 | 05220057 | 0.494459 | 0.00344199 | 215.068 | 05220056 | 0.000211351 | 0.497690 | 217.513 |
| 3 | 05220053 | 0.496941 | 0.000959992 | 196.873 | 05220052 | 0.00000 | 0.497901 | 199.259 |