| Red | Green | Blue | |
| z | 17.64 | ||
| znorm | Inf | ||
| sky | -Inf | -Inf | -Inf |
| S/N | 26.8 | 42.1 | 45.1 |
| S/N(c) | 0.0 | 0.0 | 0.0 |
| SN(E/C) |
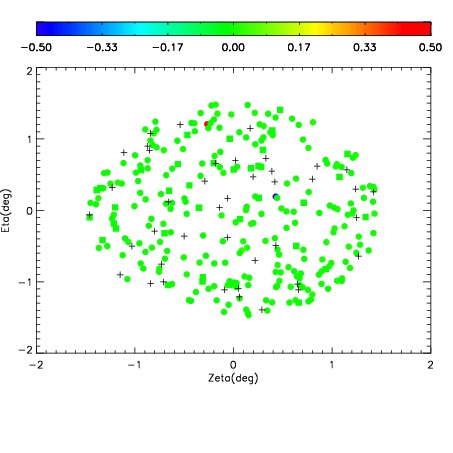
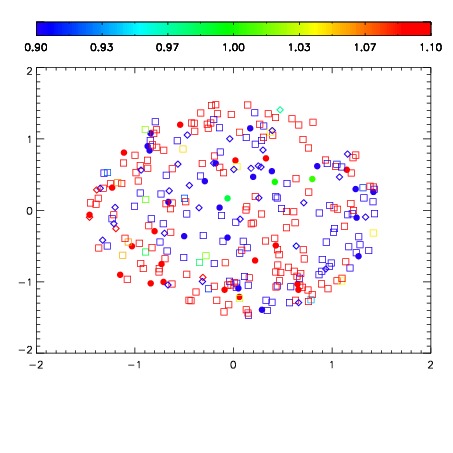


| Frame | Nreads | Zeropoints | Mag plots | Spatial mag deviation | Spatial sky 16325A emission deviations (filled: sky, open: star) | Spatial sky continuum emission | Spatial sky telluric CO2 absorption deviations (filled: H < 10) | |||||||||||||||||||||||
| 0 | 0 |
|
|
|
|
|
|
| IPAIR | NAME | SHIFT | NEWSHIFT | S/N | NAME | SHIFT | NEWSHIFT | S/N |
| 0 | 08500071 | 0.491201 | 0.00000 | 189.787 | 08500074 | 0.00363839 | 0.487563 | 187.356 |
| 1 | 08500075 | 0.489006 | 0.00219500 | 191.404 | 08500073 | 0.00504498 | 0.486156 | 190.278 |
| 2 | 08500072 | 0.490867 | 0.000334024 | 188.267 | 08500069 | 0.00319728 | 0.488004 | 185.240 |
| 3 | 08500067 | 0.488360 | 0.00284103 | 186.373 | 08500066 | 0.00000 | 0.491201 | 180.224 |
| 4 | 08500068 | 0.489782 | 0.00141901 | 180.066 | 08500070 | 0.00464684 | 0.486554 | 173.505 |