| Red | Green | Blue | |
| z | 17.64 | ||
| znorm | Inf | ||
| sky | -NaN | -Inf | -Inf |
| S/N | 24.0 | 39.8 | 45.3 |
| S/N(c) | 0.0 | 0.0 | 0.0 |
| SN(E/C) |
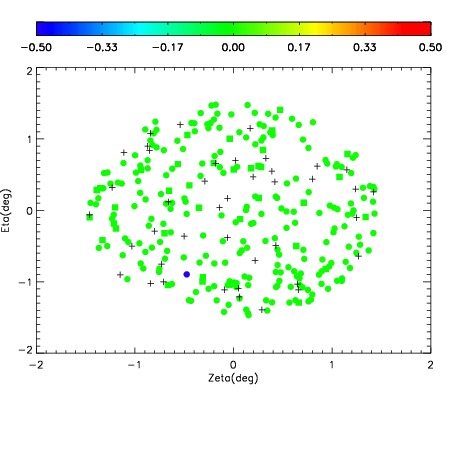
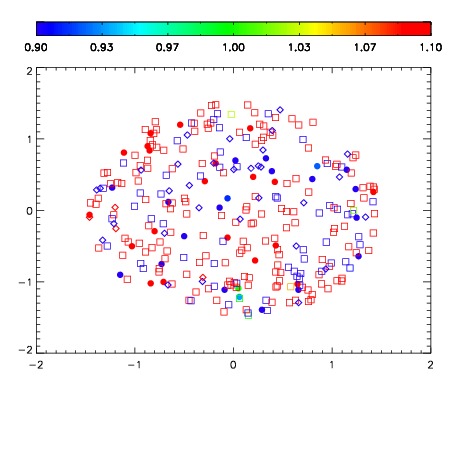
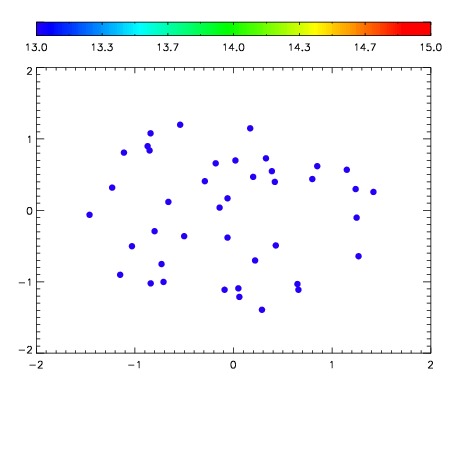

| Frame | Nreads | Zeropoints | Mag plots | Spatial mag deviation | Spatial sky 16325A emission deviations (filled: sky, open: star) | Spatial sky continuum emission | Spatial sky telluric CO2 absorption deviations (filled: H < 10) | |||||||||||||||||||||||
| 0 | 0 |
|
|
|
|
|
|
| IPAIR | NAME | SHIFT | NEWSHIFT | S/N | NAME | SHIFT | NEWSHIFT | S/N |
| 0 | 08810028 | 0.482318 | 0.00000 | 187.252 | 08810026 | 0.00000 | 0.482318 | 181.539 |
| 1 | 08810032 | 0.479878 | 0.00244001 | 200.972 | 08810033 | 0.00105070 | 0.481267 | 199.267 |
| 2 | 08810031 | 0.479668 | 0.00265002 | 197.786 | 08810030 | 0.00191934 | 0.480399 | 196.106 |
| 3 | 08810027 | 0.481748 | 0.000569999 | 193.869 | 08810029 | 0.00179380 | 0.480524 | 191.104 |