| Red | Green | Blue | |
| z | 17.64 | ||
| znorm | Inf | ||
| sky | -Inf | -Inf | -Inf |
| S/N | 29.2 | 48.3 | 50.1 |
| S/N(c) | 0.0 | 0.0 | 0.0 |
| SN(E/C) |
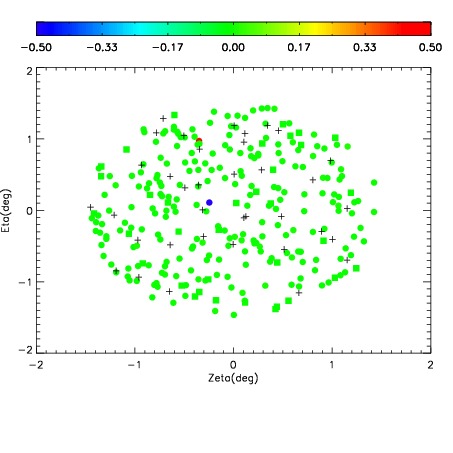
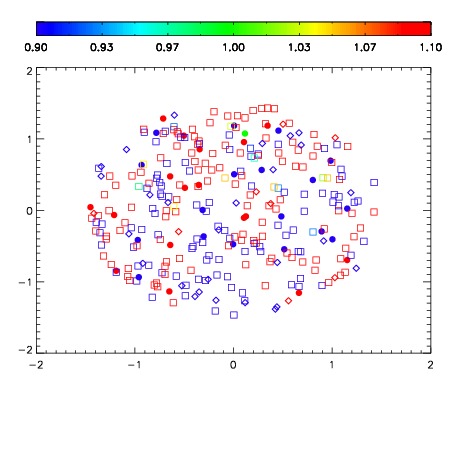
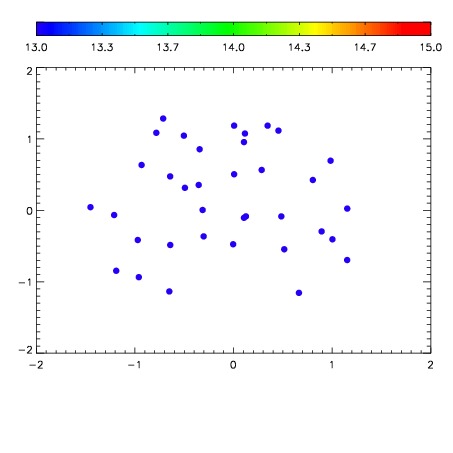

| Frame | Nreads | Zeropoints | Mag plots | Spatial mag deviation | Spatial sky 16325A emission deviations (filled: sky, open: star) | Spatial sky continuum emission | Spatial sky telluric CO2 absorption deviations (filled: H < 10) | |||||||||||||||||||||||
| 0 | 0 |
|
|
|
|
|
|
| IPAIR | NAME | SHIFT | NEWSHIFT | S/N | NAME | SHIFT | NEWSHIFT | S/N |
| 0 | 09810013 | 0.520347 | 0.00000 | 192.271 | 09810014 | -0.00186301 | 0.522210 | 195.974 |
| 1 | 09810012 | 0.520325 | 2.19941e-05 | 191.535 | 09810011 | 0.00000 | 0.520347 | 192.721 |
| 2 | 09810016 | 0.519511 | 0.000836015 | 180.700 | 09810015 | -0.00208849 | 0.522435 | 192.270 |
| 3 | 09810017 | 0.520084 | 0.000262976 | 174.948 | 09810018 | -0.00214676 | 0.522494 | 179.728 |