| Red | Green | Blue | |
| z | 17.64 | ||
| znorm | Inf | ||
| sky | -Inf | -Inf | -Inf |
| S/N | 24.4 | 39.8 | 45.5 |
| S/N(c) | 0.0 | 0.0 | 0.0 |
| SN(E/C) |
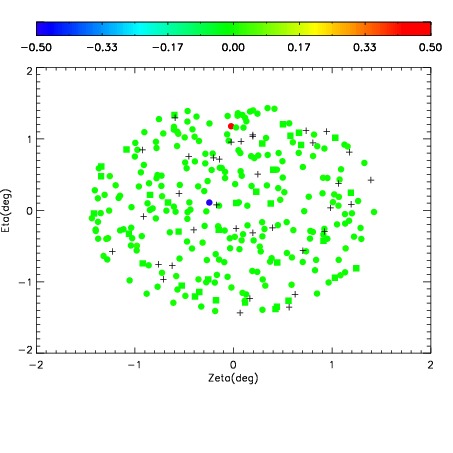
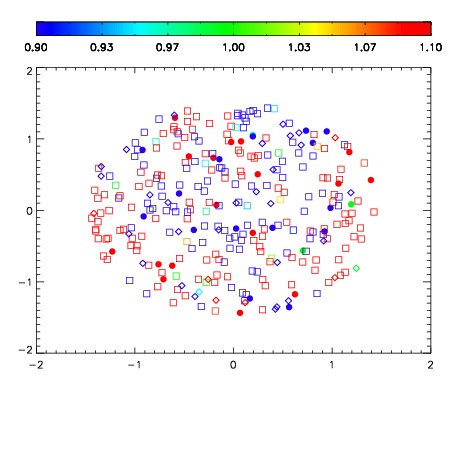
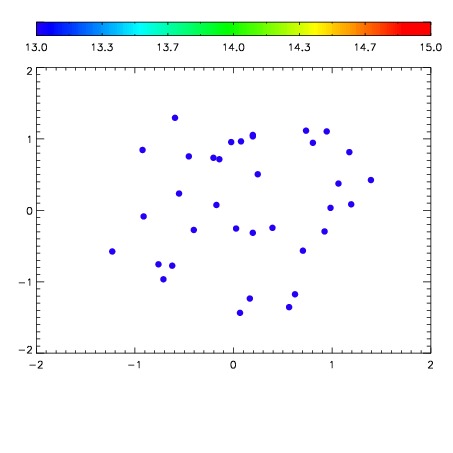

| Frame | Nreads | Zeropoints | Mag plots | Spatial mag deviation | Spatial sky 16325A emission deviations (filled: sky, open: star) | Spatial sky continuum emission | Spatial sky telluric CO2 absorption deviations (filled: H < 10) | |||||||||||||||||||||||
| 0 | 0 |
|
|
|
|
|
|
| IPAIR | NAME | SHIFT | NEWSHIFT | S/N | NAME | SHIFT | NEWSHIFT | S/N |
| 0 | 09820016 | 0.525906 | 0.00000 | 196.917 | 09820011 | 0.00000 | 0.525906 | 194.648 |
| 1 | 09820013 | 0.522434 | 0.00347203 | 201.487 | 09820015 | 0.00153240 | 0.524374 | 196.337 |
| 2 | 09820012 | 0.523057 | 0.00284904 | 194.899 | 09820018 | 0.00165555 | 0.524250 | 191.957 |
| 3 | 09820017 | 0.525848 | 5.80549e-05 | 187.529 | 09820014 | 0.00154160 | 0.524364 | 191.670 |