| Frame | Nreads | Zeropoints | Mag plots
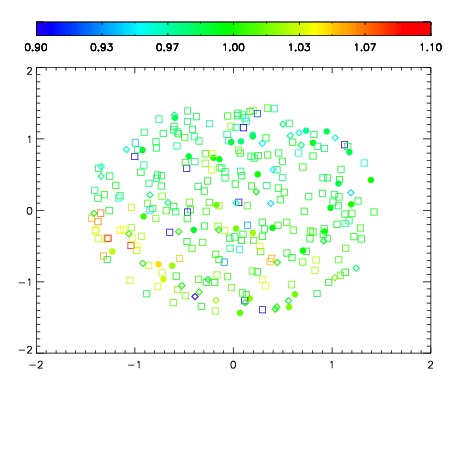
| Spatial mag deviation
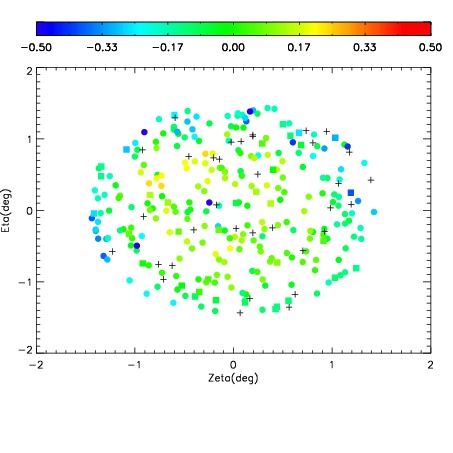
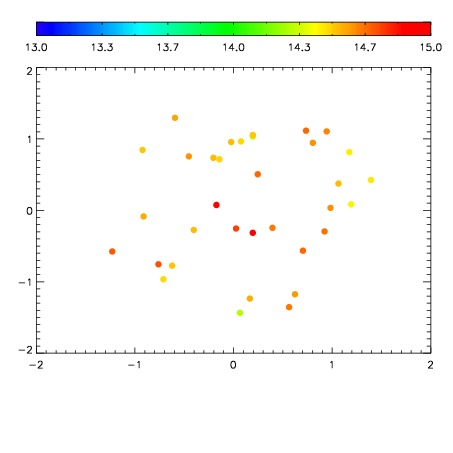
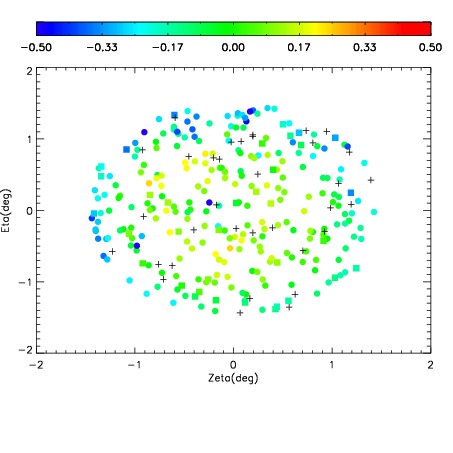
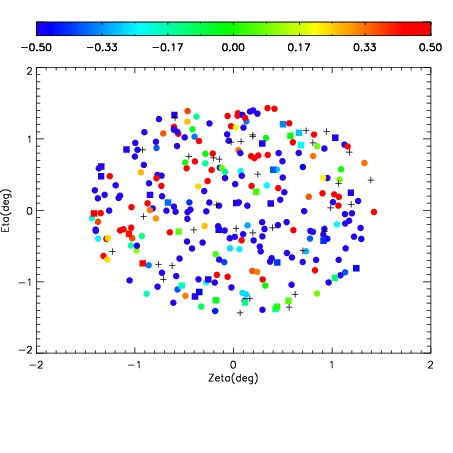
| Spatial sky 16325A emission deviations (filled: sky, open: star)
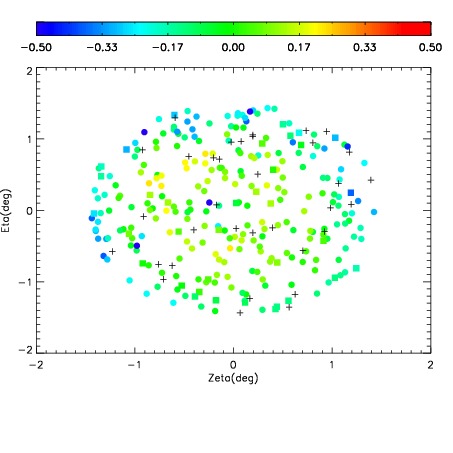
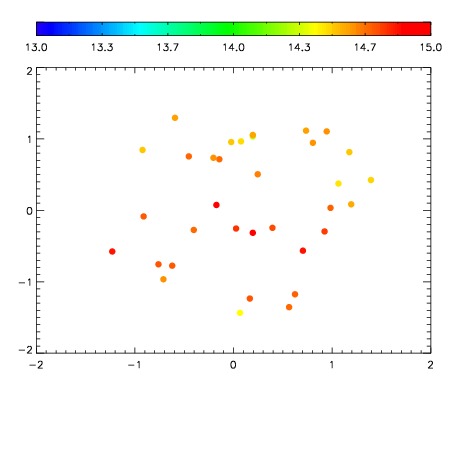
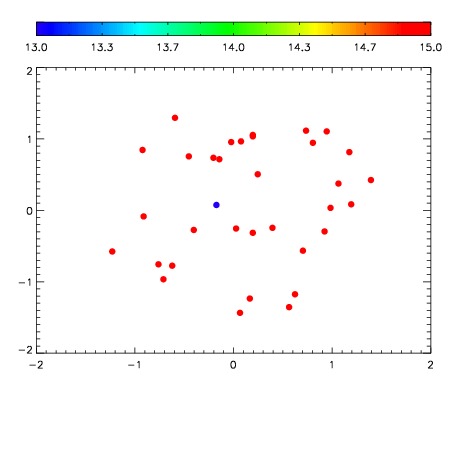
| Spatial sky continuum emission
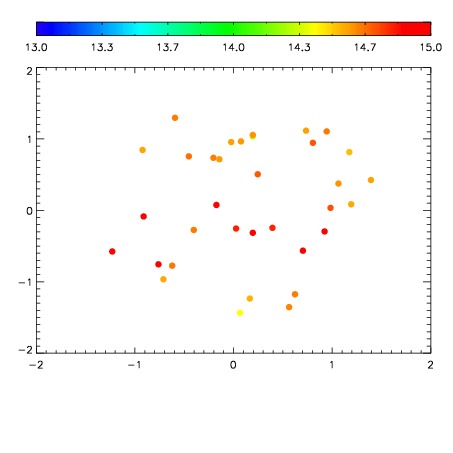
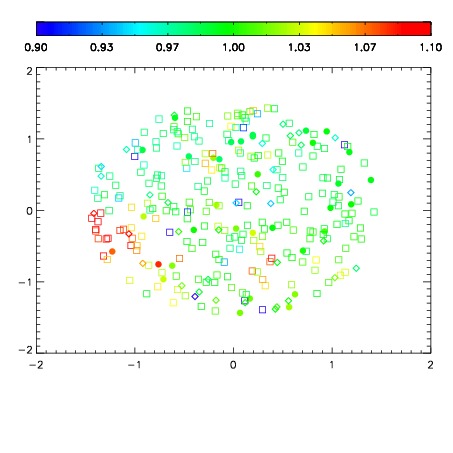
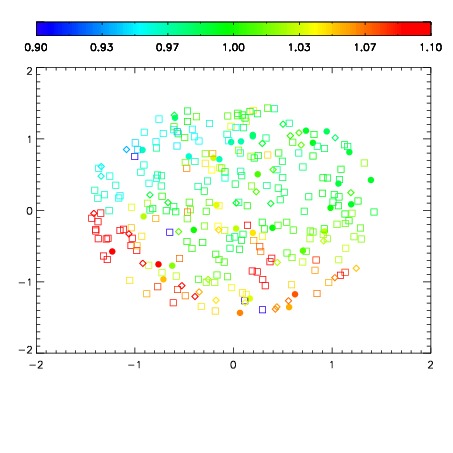
| Spatial sky telluric CO2 absorption deviations (filled: H < 10)
|
| 9960018
| 47
| | Red | Green | Blue
| | z | | 18.65
| | znorm | | 14.47
| | sky | 14.6 | 14.6 | 14.3
| | S/N | 11.9 | 19.6 | 20.0
| | S/N(c) | 10.2 | 18.4 | 18.5
| | SN(E/C) 0.94
|
| 
| 
| 
| 
| 
|
| 9960019
| 47
| | Red | Green | Blue
| | z | | 18.69
| | znorm | | 14.51
| | sky | 14.9 | 14.7 | 14.7
| | S/N | 12.0 | 19.8 | 20.5
| | S/N(c) | 10.4 | 18.6 | 19.1
| | SN(E/C) 0.95
|
| 
| 
| 
| 
| 
|
| 9960020
| 47
| | Red | Green | Blue
| | z | | 18.68
| | znorm | | 14.50
| | sky | 14.7 | 14.6 | 14.8
| | S/N | 11.5 | 19.7 | 20.2
| | S/N(c) | 10.1 | 18.0 | 18.6
| | SN(E/C) 0.92
|
| 
| 
| 
| 
| 
|
| 9960021
| 47
| | Red | Green | Blue
| | z | | 13.53
| | znorm | | 9.35
| | sky | 15.2 | 15.6 | 17.2
| | S/N | 0.1 | 0.2 | 3.3
| | S/N(c) | 0.0 | 0.0 | 0.0
| | SN(E/C) 1.18
|
| 
| 
| 
| 
| 
|