| Red | Green | Blue | |
| z | 17.64 | ||
| znorm | Inf | ||
| sky | -NaN | -Inf | -Inf |
| S/N | 22.3 | 37.8 | 41.6 |
| S/N(c) | 0.0 | 0.0 | 0.0 |
| SN(E/C) |
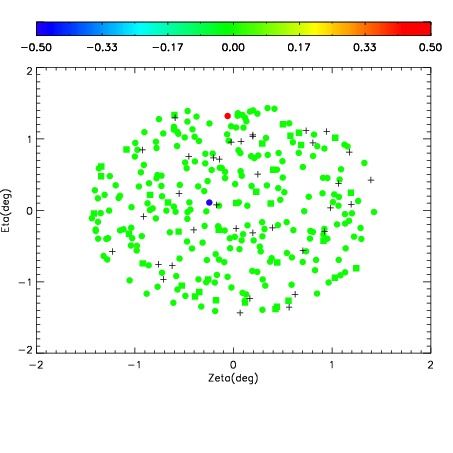
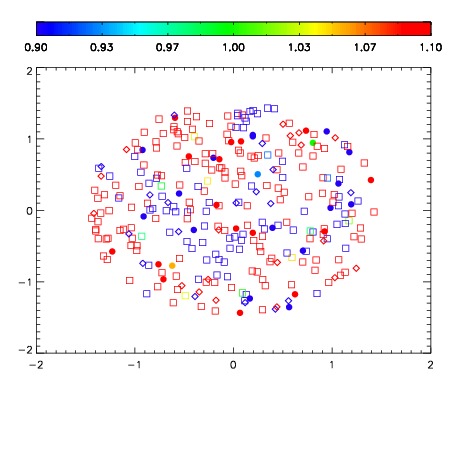
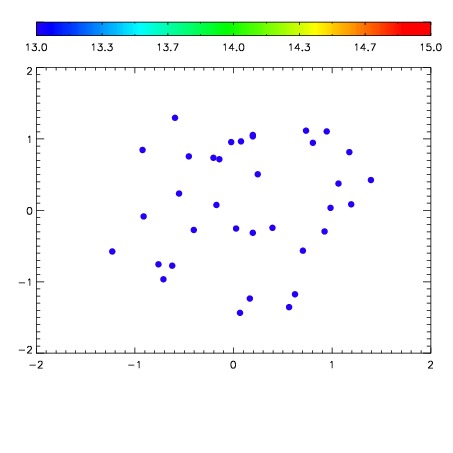

| Frame | Nreads | Zeropoints | Mag plots | Spatial mag deviation | Spatial sky 16325A emission deviations (filled: sky, open: star) | Spatial sky continuum emission | Spatial sky telluric CO2 absorption deviations (filled: H < 10) | |||||||||||||||||||||||
| 0 | 0 |
|
|
|
|
|
|
| IPAIR | NAME | SHIFT | NEWSHIFT | S/N | NAME | SHIFT | NEWSHIFT | S/N |
| 0 | 09970017 | 0.522779 | 0.00000 | 201.063 | 09970018 | 0.00150342 | 0.521276 | 195.114 |
| 1 | 09970016 | 0.522225 | 0.000553966 | 197.586 | 09970015 | -7.56443e-05 | 0.522855 | 194.678 |
| 2 | 09970013 | 0.521678 | 0.00110102 | 192.993 | 09970014 | 0.000239994 | 0.522539 | 191.464 |
| 3 | 09970012 | 0.521663 | 0.00111598 | 189.017 | 09970011 | 0.00000 | 0.522779 | 184.027 |