| Red | Green | Blue | |
| z | 17.63 | ||
| znorm | Inf | ||
| sky | -NaN | -Inf | -Inf |
| S/N | 18.0 | 31.3 | 36.0 |
| S/N(c) | 0.0 | 0.0 | 0.0 |
| SN(E/C) |
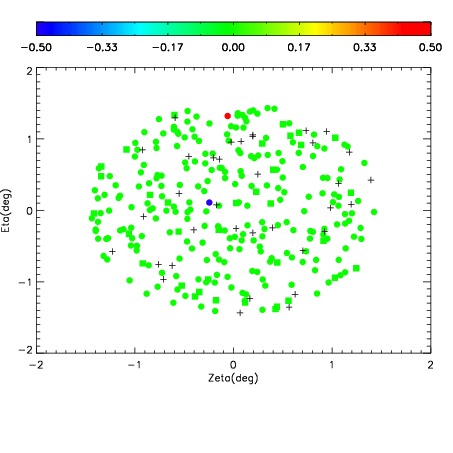
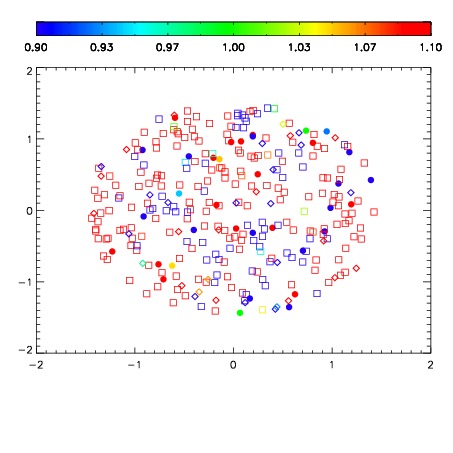
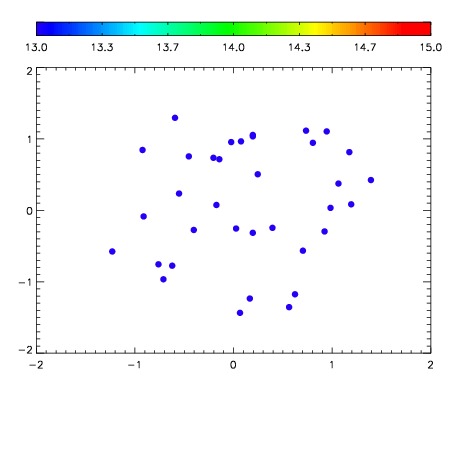

| Frame | Nreads | Zeropoints | Mag plots | Spatial mag deviation | Spatial sky 16325A emission deviations (filled: sky, open: star) | Spatial sky continuum emission | Spatial sky telluric CO2 absorption deviations (filled: H < 10) | |||||||||||||||||||||||
| 0 | 0 |
|
|
|
|
|
|
| IPAIR | NAME | SHIFT | NEWSHIFT | S/N | NAME | SHIFT | NEWSHIFT | S/N |
| 0 | 12130038 | 0.496772 | 0.00000 | 155.036 | 12130037 | 0.00000 | 0.496772 | 151.033 |
| 1 | 12130043 | 0.494713 | 0.00205898 | 173.127 | 12130044 | -0.00144704 | 0.498219 | 177.422 |
| 2 | 12130042 | 0.494663 | 0.00210899 | 169.455 | 12130041 | -0.00176859 | 0.498541 | 165.487 |
| 3 | 12130039 | 0.496415 | 0.000357002 | 143.273 | 12130040 | -0.00138723 | 0.498159 | 145.894 |