| Red | Green | Blue | |
| z | 17.64 | ||
| znorm | Inf | ||
| sky | -Inf | -Inf | -Inf |
| S/N | 23.7 | 39.1 | 40.6 |
| S/N(c) | 0.0 | 0.0 | 0.0 |
| SN(E/C) |

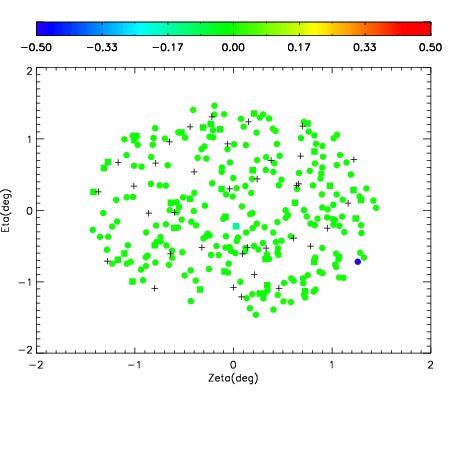
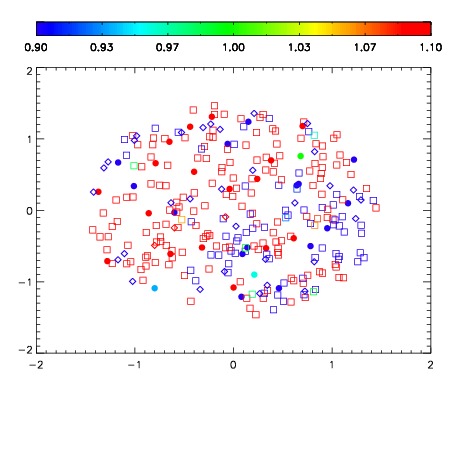
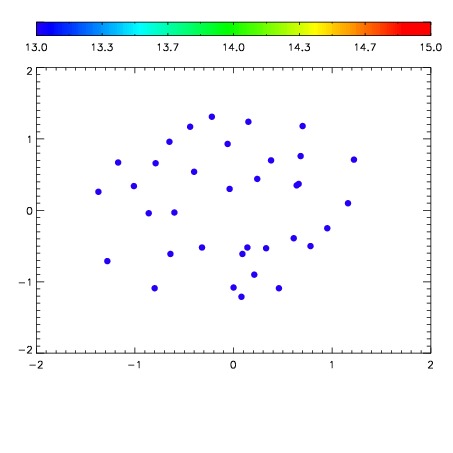

| Frame | Nreads | Zeropoints | Mag plots | Spatial mag deviation | Spatial sky 16325A emission deviations (filled: sky, open: star) | Spatial sky continuum emission | Spatial sky telluric CO2 absorption deviations (filled: H < 10) | |||||||||||||||||||||||
| 0 | 0 |
|
|
|
|
|
|
| IPAIR | NAME | SHIFT | NEWSHIFT | S/N | NAME | SHIFT | NEWSHIFT | S/N |
| 0 | 12240082 | 0.491780 | 0.00000 | 194.006 | 12240077 | 0.00000 | 0.491780 | 195.181 |
| 1 | 12240078 | 0.489888 | 0.00189200 | 190.091 | 12240081 | -0.00216528 | 0.493945 | 193.038 |
| 2 | 12240079 | 0.490443 | 0.00133702 | 186.299 | 12240080 | -0.00204723 | 0.493827 | 192.921 |