| Red | Green | Blue | |
| z | 17.64 | ||
| znorm | Inf | ||
| sky | -Inf | -Inf | -Inf |
| S/N | 19.3 | 31.4 | 33.0 |
| S/N(c) | 0.0 | 0.0 | 0.0 |
| SN(E/C) |

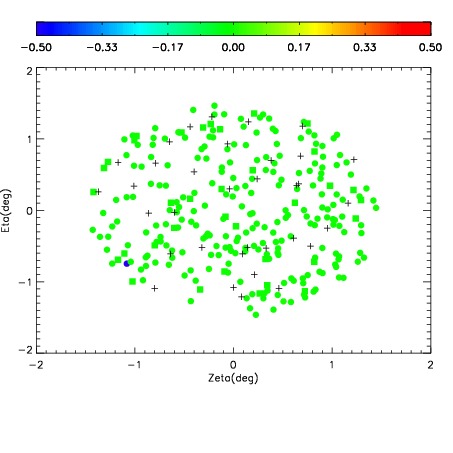
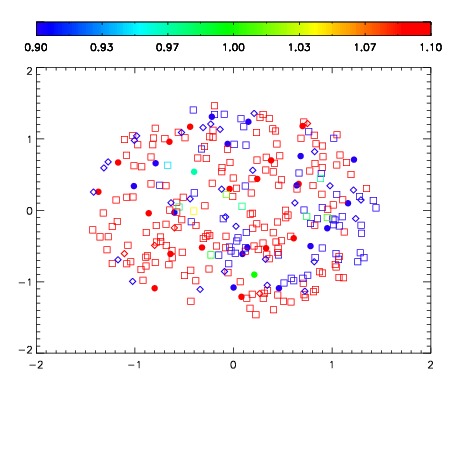
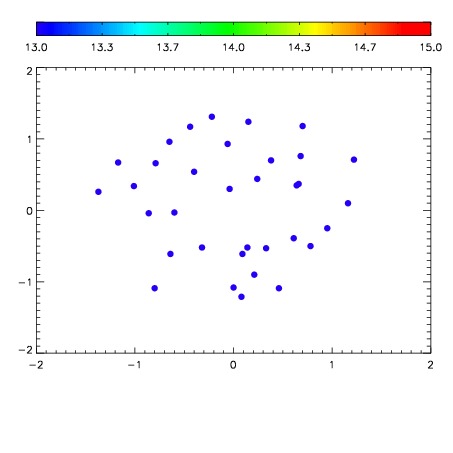

| Frame | Nreads | Zeropoints | Mag plots | Spatial mag deviation | Spatial sky 16325A emission deviations (filled: sky, open: star) | Spatial sky continuum emission | Spatial sky telluric CO2 absorption deviations (filled: H < 10) | |||||||||||||||||||||||
| 0 | 0 |
|
|
|
|
|
|
| IPAIR | NAME | SHIFT | NEWSHIFT | S/N | NAME | SHIFT | NEWSHIFT | S/N |
| 0 | 12300028 | 0.493106 | 0.00000 | 124.474 | 12300025 | -0.000655980 | 0.493762 | 130.330 |
| 1 | 12300024 | 0.491399 | 0.00170702 | 126.479 | 12300029 | -0.00118292 | 0.494289 | 133.275 |
| 2 | 12300023 | 0.491532 | 0.00157401 | 125.827 | 12300026 | -0.000794120 | 0.493900 | 131.658 |
| 3 | 12300027 | 0.492714 | 0.000392020 | 120.445 | 12300022 | 0.00000 | 0.493106 | 122.863 |