| Red | Green | Blue | |
| z | 17.64 | ||
| znorm | Inf | ||
| sky | -NaN | -NaN | -Inf |
| S/N | 25.6 | 43.2 | 44.9 |
| S/N(c) | 0.0 | 0.0 | 0.0 |
| SN(E/C) |
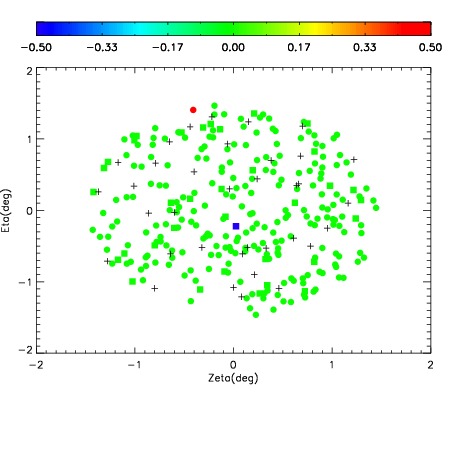
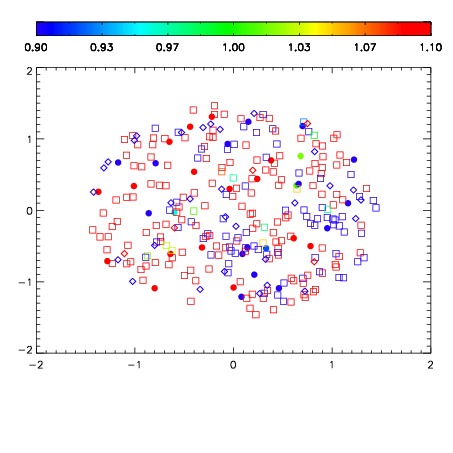
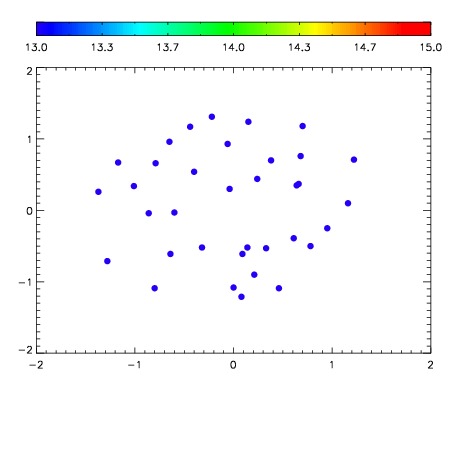

| Frame | Nreads | Zeropoints | Mag plots | Spatial mag deviation | Spatial sky 16325A emission deviations (filled: sky, open: star) | Spatial sky continuum emission | Spatial sky telluric CO2 absorption deviations (filled: H < 10) | |||||||||||||||||||||||
| 0 | 0 |
|
|
|
|
|
|
| IPAIR | NAME | SHIFT | NEWSHIFT | S/N | NAME | SHIFT | NEWSHIFT | S/N |
| 0 | 12430028 | 0.490530 | 0.00000 | 174.946 | 12430029 | -0.00346211 | 0.493992 | 173.575 |
| 1 | 12430027 | 0.489933 | 0.000597000 | 163.071 | 12430025 | -0.00449284 | 0.495023 | 161.559 |
| 2 | 12430024 | 0.489239 | 0.00129101 | 159.758 | 12430026 | -0.00376783 | 0.494298 | 159.138 |
| 3 | 12430023 | 0.488782 | 0.00174803 | 148.710 | 12430022 | 0.00000 | 0.490530 | 145.484 |