| Red | Green | Blue | |
| z | 17.64 | ||
| znorm | Inf | ||
| sky | -Inf | -NaN | -Inf |
| S/N | 30.6 | 49.3 | 52.7 |
| S/N(c) | 0.0 | 0.0 | 0.0 |
| SN(E/C) |
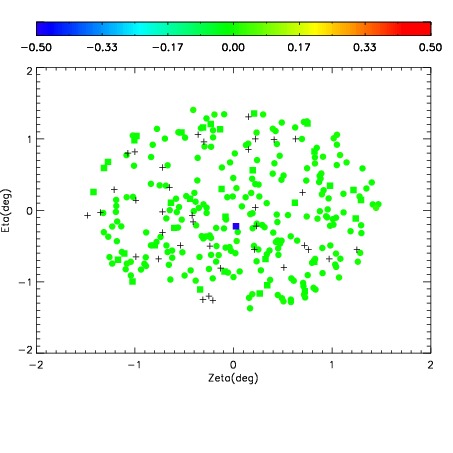
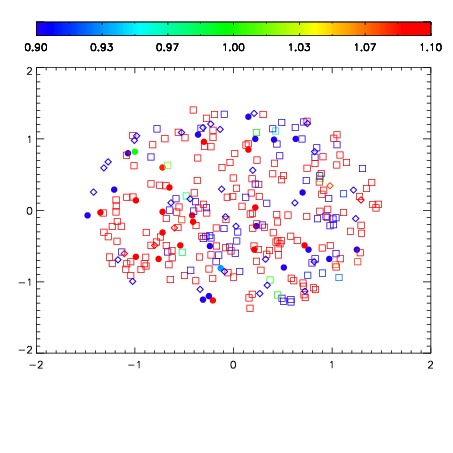
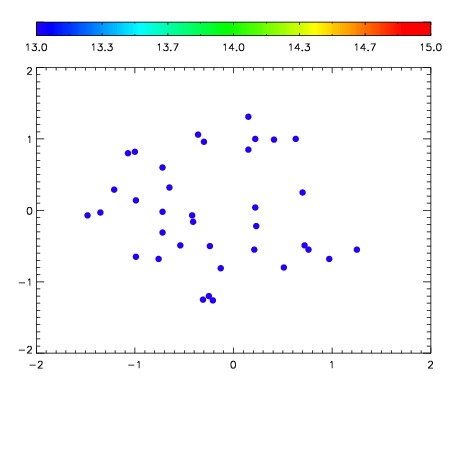

| Frame | Nreads | Zeropoints | Mag plots | Spatial mag deviation | Spatial sky 16325A emission deviations (filled: sky, open: star) | Spatial sky continuum emission | Spatial sky telluric CO2 absorption deviations (filled: H < 10) | |||||||||||||||||||||||
| 0 | 0 |
|
|
|
|
|
|
| IPAIR | NAME | SHIFT | NEWSHIFT | S/N | NAME | SHIFT | NEWSHIFT | S/N |
| 0 | 12190067 | 0.502500 | 0.00000 | 229.350 | 12190066 | 0.00000 | 0.502500 | 230.215 |
| 1 | 12190072 | 0.501695 | 0.000805020 | 241.554 | 12190073 | -0.00164032 | 0.504140 | 241.675 |
| 2 | 12190071 | 0.500572 | 0.00192797 | 240.032 | 12190070 | -0.000338777 | 0.502839 | 237.065 |
| 3 | 12190068 | 0.502494 | 6.02007e-06 | 233.699 | 12190069 | -0.000813129 | 0.503313 | 235.237 |